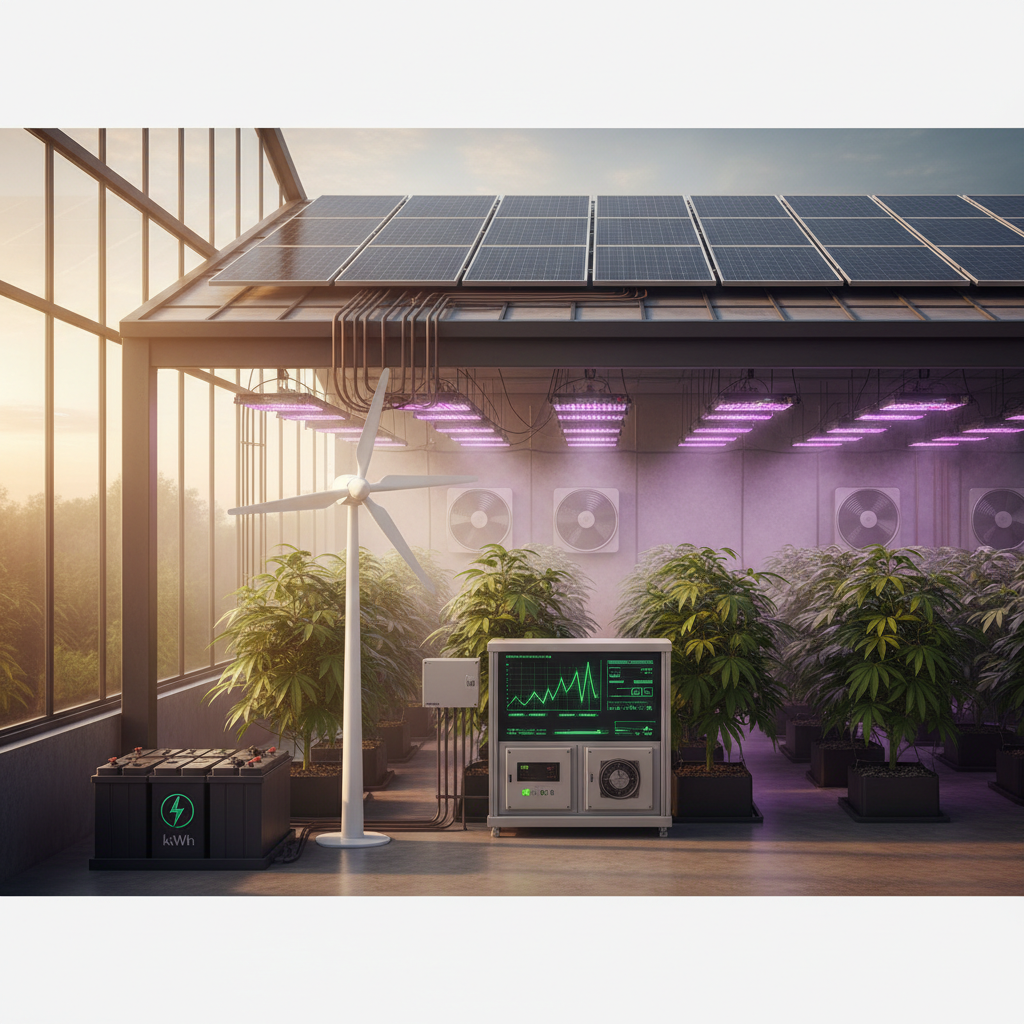
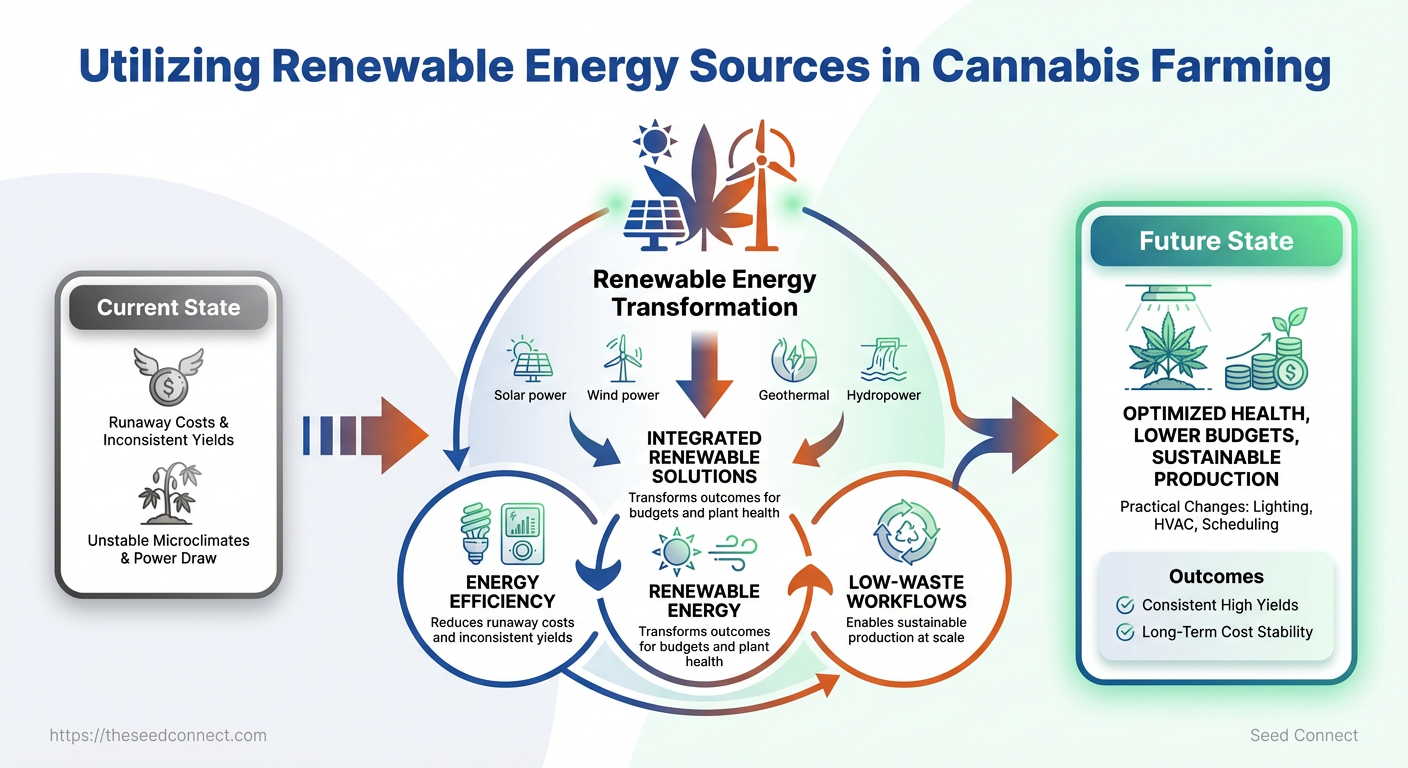
Grow rooms that spike electricity bills every month and live plants wilting under heat stress are not inevitable. Small design choices — lighting schedules, ventilation layout, or inefficient ballasts — compound into runaway costs and inconsistent yields within a single grow cycle. Addressing those mistakes starts by treating energy efficiency as a cultivation variable, not just a utility bill.
Shifting to renewable energy sources and low-waste workflows transforms outcomes for both budgets and plant health, making sustainable cannabis production attainable at scale. Practical changes to lighting, HVAC, and scheduling produce measurable drops in power draw while stabilizing microclimates that plants prefer. []
Assessing Your Farm’s Energy Profile
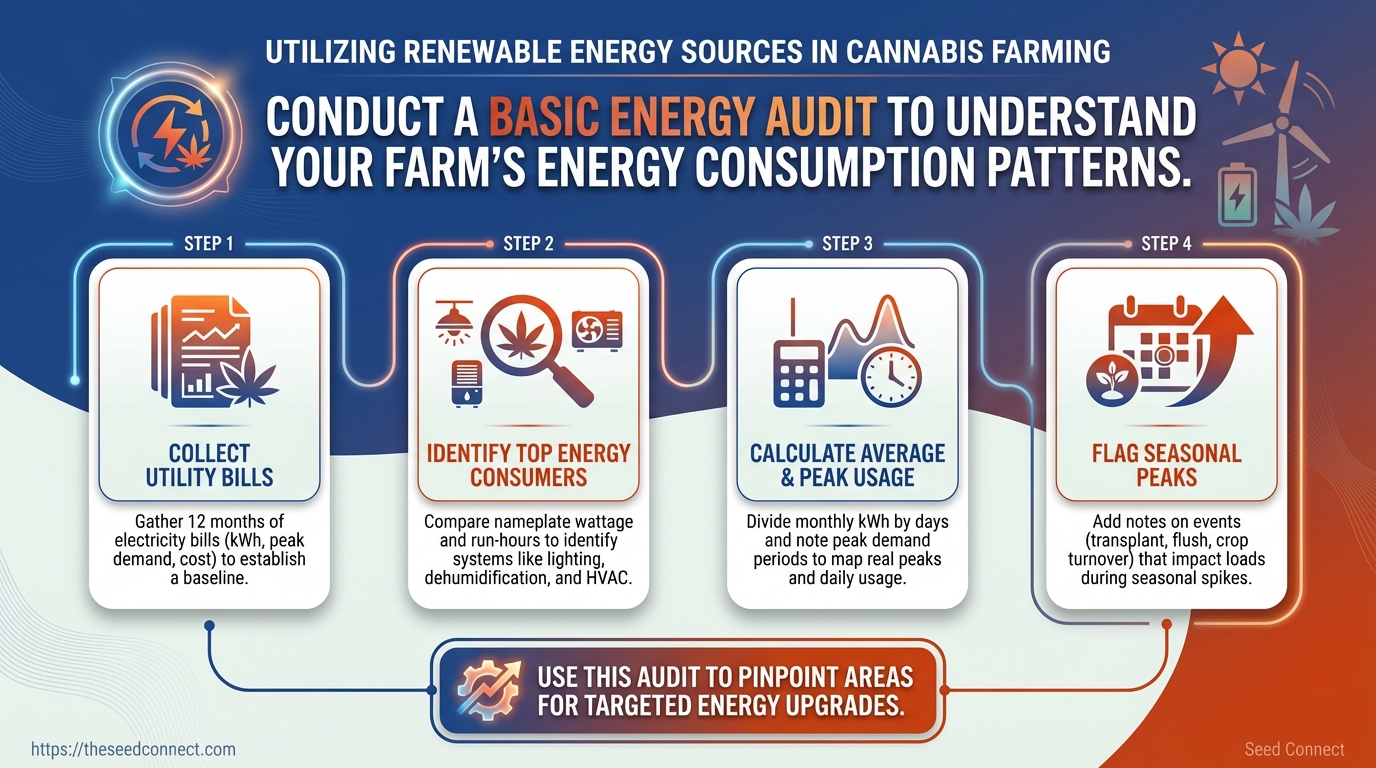
Start by measuring: a clear baseline of monthly use, peaks and the systems driving those loads makes every efficiency decision measurable and defensible. For indoor cannabis grows, lighting and HVAC dominate consumption, so the first task is assembling bill data and on-site readings to turn anecdotes into numbers.
Prerequisites
Utility bills: Collect 12 months of electricity bills (kWh and demand charges).
On-site meter access: Temporary clamp meters or existing submeters for peak checks.
Simple spreadsheet: Log monthly kWh, peak kW, and estimated cost to compute averages and seasonal swings.
Tools & materials
- Clamp meter or inline energy meter for spot measurements.
- Spreadsheet or energy-audit template to log and graph trends.
- Stopwatch or scheduler to confirm run-hours for lights, fans, dehumidifiers.
- Conduct a Basic Energy Audit
- Collect 12 months of utility bills and log monthly kWh, peak demand (kW), and cost. This provides a rolling baseline and exposes seasonal spikes tied to HVAC or supplemental lighting.
- Identify top energy-consuming systems by comparing nameplate wattage multiplied by run-hours to monthly kWh. Focus on systems that appear in the top three contributors—typically lighting, dehumidification, and HVAC.
- Calculate average daily and peak usage by dividing monthly kWh by days and noting the utility billing peak demand periods. Track a few days of hourly usage if possible to map real peaks.
- Flag seasonal peaks tied to HVAC or lighting and add notes on events (transplant, flush, crop turnover) that temporarily increase loads.
### Provide a template to log monthly energy use and calculate averages/peaks
| Month | kWh Used | Peak Demand (kW) | Estimated Cost ($) | Notes (High loads/Events) |
|---|---|---|---|---|
| January | 11,500 | 55 | 1,380 | HVAC heavy during winter ventilation |
| February | 10,800 | 52 | 1,296 | Stable runs, seedling turnover |
| March | 12,400 | 60 | 1,488 | Increased lighting hours post-clone |
| April | 13,700 | 65 | 1,644 | Dehumidifiers increased during veg |
| May | 15,200 | 72 | 1,824 | Flower room peak, higher HVAC load |
Key insight: Logging monthly kWh and peak demand highlights how seasonal events and crop stages shift energy profiles; this reveals which months deliver the best ROI for targeted upgrades.
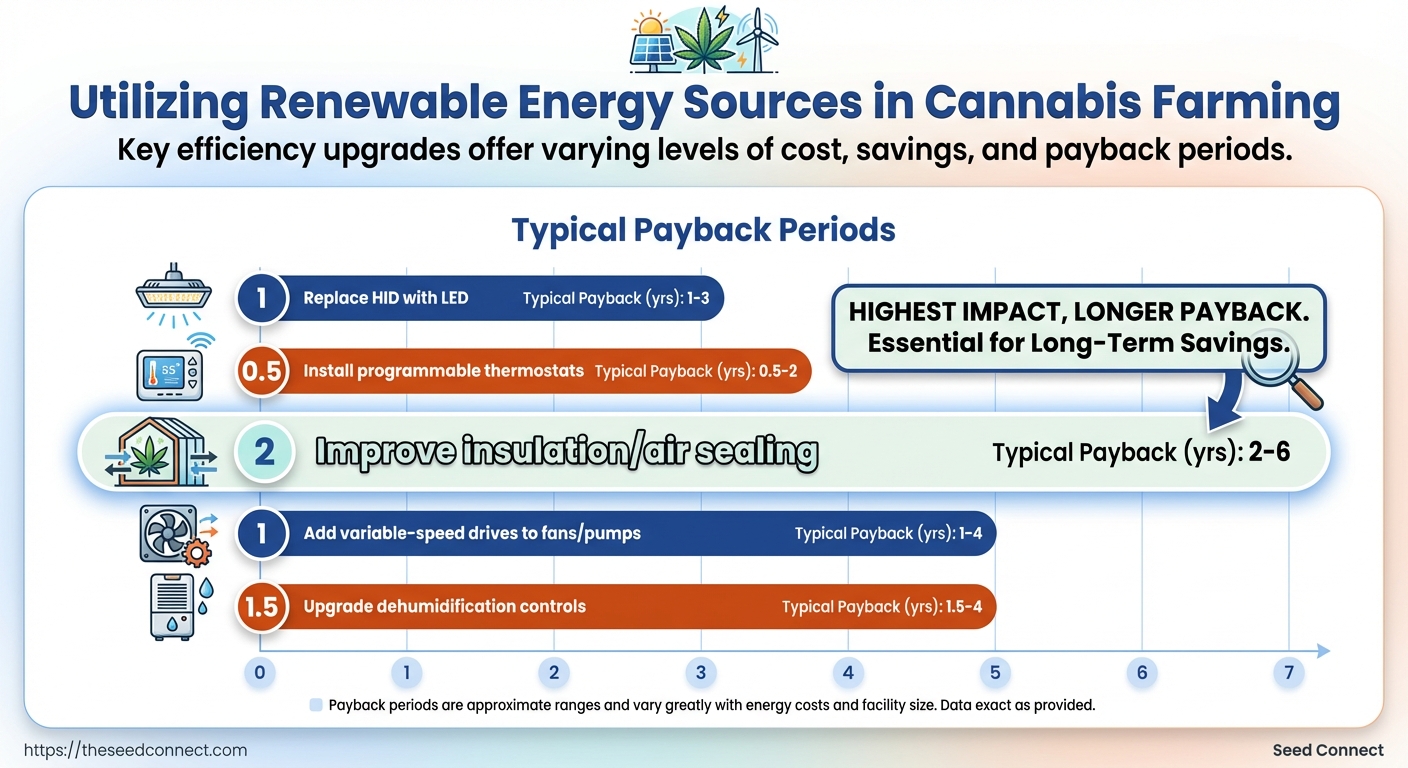
- Identify High-Impact Efficiency Measures
- Target lighting and HVAC first—these typically deliver the largest kWh reductions for the least operational risk. Measure actual run-hours versus necessary run-hours before changing schedules.
- Look for simple controls: timers for lights, programmable thermostats for HVAC, and
VFDs(variable-frequency drives) for fans and pumps to reduce part-load energy use. - Prioritize actions by ROI and disruption: quick wins (LED retrofit, programmable controls) before high-disruption measures (ducting overhaul, major HVAC replacement).
### Common efficiency upgrades by cost, disruption, estimated savings, and payback
| Upgrade | Estimated Cost | Estimated Annual kWh Savings | Disruption Level | Typical Payback (yrs) |
|---|---|---|---|---|
| Replace HID with LED | $200–$1,200 per fixture | 30–50% per light bank (~30,000 kWh/yr) | Low–Medium | 1–3 |
| Install programmable thermostats | $150–$500 per zone | 8–15% HVAC savings (~5,000 kWh/yr) | Low | 0.5–2 |
| Add variable-speed drives to fans/pumps | $800–$3,000 each | 20–40% on motor circuits (~4,000 kWh/yr) | Medium | 1–4 |
| Improve insulation/air sealing | $1,000–$10,000 facility-wide | 5–20% HVAC savings (~3,000–12,000 kWh/yr) | Medium–High | 2–6 |
| Upgrade dehumidification controls | $2,000–$12,000 | 15–35% dehumidifier savings (~6,000 kWh/yr) | Medium | 1.5–4 |
Key insight: LED retrofits and control upgrades offer the fastest paybacks with minimal crop disruption, while building envelope and major HVAC work deliver deeper, longer-term savings.
Practical troubleshooting: if measured savings fall short of projections, re-check run-hour logs, ensure controls are commissioned, and confirm space pressurization and ducting are correct. Understanding these principles accelerates decisions and reduces wasted capital by focusing on high-impact, verifiable measures that fit crop cycles and operational constraints.
Choosing Renewable Energy Options
Start by matching renewables to the facility’s energy profile and site constraints. For many cannabis operations, the fastest wins come from on-site solar PV where roof or land is available; wind, biogas, and geothermal each play clear roles where resource conditions and waste streams align. Evaluate each option against usable area, load coverage targets, permitting, and lifecycle cost to make a prioritized shortlist.
Prerequisites
Site energy audit: A 12-month load profile with peak demand, time-of-use patterns, and future growth projections.
Structural survey: Roof load capacity and shading analysis for PV; soil and subsurface data for geothermal.
Regulatory check: Local net-metering, interconnection rules, noise ordinances, and permitting timelines.
Evaluate On-site Solar PV
- Measure usable area and shading.
- Calculate the contiguous, unobstructed roof or ground area and run a basic
solar accessmodel to estimate effective panel coverage percentage. - Estimate system size needed to cover target percent of load.
- Convert annual kWh demand into required DC capacity using
system_size_kW = annual_kWh / (annual_kWh_per_kW)where typicalannual_kWh_per_kWis 1,100–1,400 kWh/kW depending on location. - Check roof load capacity and commission a structural review.
- Confirm racking type and ballast needs; heavy ballast increases cost and may require reinforcements.
- Review incentives and net-metering rules.
- Factor rebates, accelerated depreciation, and local utility buyback rates into simple payback and IRR models.
Tools & materials
- Solar access tool: simple shading analysis or smartphone fisheye for quick checks.
- Load profile CSV: 12 months, hourly if available.
- Structural report: stamped engineering letter if roof-mounted.
Expected outcomes
- Feasible system size: kW and estimated % of annual load covered.
- Preliminary payback: 5–12 years typical depending on incentives.
- Primary constraints identified: shading, structural limits, interconnection caps.
### Solar mounting options and trade-offs (roof vs ground vs carport)
| Mounting Type | Space Efficiency | Installation Cost | Maintenance Needs | Ideal Use Case |
|---|---|---|---|---|
| Flat Roof Mount | High with tilt racks | Moderate | Low; easy access | Commercial flat roofs |
| Pitched Roof Mount | Moderate | Lower than ground | Low; slope-dependent | Existing sloped roofs |
| Ground Array | Very high (scalable) | Higher (site prep) | Moderate; vegetation control | Large land plots |
| Carport/Canopy | Moderate; dual-use | Higher per kW | Low; accessible | Parking, shade + generation |
| Building-Integrated PV | Low (aesthetic) | High | Low; specialized | New builds, facade value |
Key insight: roof-mounted systems minimize land use and often cost less per kW, while ground and carport arrays suit expansions or dual-use requirements.
Consider Wind, Biogas, and Geothermal
Wind: Requires consistent mean wind speeds above site-specific cut-in thresholds; small turbines can work for remote sites but commercial-scale wind needs open terrain and detailed wind resource assessment.
Biogas: Best for farms with steady organic waste streams; anaerobic digesters convert manure and trim waste into dispatchable gas and renewable heat, improving waste management and lowering emissions.
Geothermal: Provides stable heating/cooling and can dramatically reduce HVAC electrical loads, but carries higher upfront drilling and ground-loop costs; strong fit where long-term thermal loads and land rights are clear.
Troubleshooting tips
- If shading limits PV: prioritize ground or carport arrays or deploy bifacial panels.
- If permits slow deployment: stage projects and secure temporary generation credits.
- If waste stream is intermittent: pair biogas with battery or grid backup.
Understanding these principles helps teams choose options that match site realities and operational goals without overcommitting capital. When the technical fit, permitting, and financials align, the right mix of solar, wind, biogas, or geothermal will materially lower energy risk for sustainable cannabis operations.
Designing a Hybrid Renewable + Efficiency Plan
Start by reducing demand first; resizing generation after efficiency upgrades lowers capital cost and speeds ROI. Efficiency work follows a predictable sequence: audit → targeted upgrades → re-audit → right-size renewables. That sequence reduces inverter and PV overbuild, and it often cuts required battery capacity by the same fraction.
- Perform an energy audit (week 0–2).
- Implement quick wins (week 2–8): LED retrofits, variable-speed drives, airflow sealing.
- Re-audit and re-baseline (week 8–10).
- Size generation and storage based on reduced load (week 10–14).
Sample math for resizing a PV system after savings: A facility has a 200 kW peak load and annual use of 1,200,000 kWh. Efficiency projects cut energy use by 25% → new annual use = 900,000 kWh. Original PV estimate to offset 70% of load at site production: 200 kW × 0.7 = 140 kW. After savings, required PV = 140 kW × 0.75 = 105 kW. * Capital reduction roughly proportional: 105/140 ≈ 25% less PV hardware and inverter capacity.
Practical timelines Quick wins: 2–8 weeks. Major retrofits (HVAC, envelope): 2–6 months. Renewables procurement and install: 8–16 weeks after final design. Full commissioning with EMS: 2–4 weeks.
Common efficiency measures that matter most Lighting upgrades: swap to high-efficacy LEDs and zoning controls. HVAC tuning: VFDs, setpoint optimization, demand-based ventilation. Envelope sealing: reduce infiltration and reclaim HVAC capacity. Process scheduling: shift heavy loads to daylight or low-price windows.
Backup: Reserve power for critical loads during outage (generators + battery).
Shifting: Move flexible loads to cheaper or solar-rich periods to lower bills.
Islanding: Operate off-grid during prolonged outages with seamless transition.
Battery sizing rule of thumb * Multiply critical load (kW) by desired hours to get kWh. Example: 50 kW critical × 4 hours = 200 kWh usable. Account for inverter losses and depth-of-discharge (usable_kWh = nominal_kWh × DoD × inverter_efficiency).
Choose battery technology by cycles, lifetime, and safety Lithium-ion (LFP): 3000–6000 cycles, ~$150–$300/kWh, excellent for cycling and density. Flow batteries: 10,000+ cycles, ~$400–$700/kWh, good for long-duration shifting. Lead-acid (AGM): 300–800 cycles, ~$100–$150/kWh, budget backup with short life. Thermal storage: cost varies, best for HVAC load shifting. * Hydrogen: emerging for seasonal storage; high round-trip losses today.
Integrate an Energy Management System (EMS) to dispatch batteries for demand charge reduction, solar self-consumption, or blackout resilience. EMS should allow rule-based dispatch, priority scheduling, and visibility into kW and kWh streams.
### Phased implementation timeline for small/medium/large farms
| Phase | Actions | Estimated Time | Estimated Cost Range | Priority |
|---|---|---|---|---|
| Phase 1 – Audit & Quick Wins | Walkthrough audit, LED swaps, controls | 2–8 weeks | $2k–$20k | High |
| Phase 2 – Efficiency Upgrades | HVAC tune, envelope, VFDs | 2–6 months | $20k–$200k | High |
| Phase 3 – Install Renewables | PV design & install, inverters | 8–16 weeks | $50k–$1M+ | Medium |
| Phase 4 – Add Storage/Controls | Batteries, EMS, integration | 6–12 weeks | $30k–$500k | Medium |
| Phase 5 – Monitoring & Optimization | Ongoing monitoring, re-audits | Continuous | $1k–$10k/yr | High |
Key insight: Phasing reduces upfront cost and aligns investments with measured savings; small farms often stop at Phase 3, while larger operations see best ROI by completing Phase 4 and Phase 5.
### Battery technologies and control options for cannabis farms
| Storage Type | Cycle Life | Cost per kWh | Best Use Case | Safety/Regulatory Notes |
|---|---|---|---|---|
| Lithium-ion (LFP) | 3,000–6,000 cycles | $150–$300/kWh | Frequent cycling, backup + shifting | Lower thermal runaway risk; UL-certified systems recommended |
| Flow Batteries | 10,000+ cycles | $400–$700/kWh | Long-duration shifting, high throughput | Fewer fire risks; site containment needed |
| Lead-acid (AGM) | 300–800 cycles | $100–$150/kWh | Short-term backup, low-capex installs | Ventilation required; shorter lifespan |
| Thermal Storage | N/A cycles (energy stored as heat) | Varies widely | HVAC load shifting, process heat | Fewer electrical regs; mechanical safety applies |
| Hydrogen | Component-limited cycles | $800–$2,000/kWh (system) | Seasonal storage, long-term resilience | Emerging codes; requires specialized permitting |
Key insight: LFP provides the best balance of cost, cycles, and safety for most growers today; flow and hydrogen suit long-duration needs but at higher capital cost.
Understanding these principles lets teams reduce capex and operational risk while delivering reliable power for cultivation. When efficiency is prioritized and controls are integrated, renewable investments become far more predictable and cost-effective.
Permitting, Incentives, and Financing
Permits, incentives, and financing determine whether a renewable-energy retrofit moves from concept to operation; start permitting early and quantify incentives before choosing a capital plan. Permits vary widely by city, county, and utility, and cannabis facilities face extra scrutiny on zoning, fire safety, and utility interconnection — batteries and high-capacity systems commonly trigger additional requirements.
Prerequisites
Project scope: Finalized system size, inverter and battery specs, and interconnection point.
Site documentation: Single-line electrical diagram, one-line mechanical plan, roof structural report (if rooftop).
Tools & materials
- Energy audit: Baseline load profile and peak demand data.
- Installer quote packages: Equipment specs, warranties, and interconnection estimates.
- Local code guides: Municipal zoning maps and utility interconnection requirements.
Navigate Permits and Regulations
- Start local permitting research at the municipality level and confirm cannabis-specific restrictions with the planning department.
- Compile a permit packet including the site plan, electrical one-line, battery/spec sheets, fire-suppression drawings (if applicable), and a contractor’s licensing proof.
- Engage the utility early for an interconnection application and
export limitexpectations; many utilities require load studies for commercial cannabis accounts. - Expect battery systems to require additional fire-safety measures, such as NFPA-compliant suppression, ventilation, and separation distances — budget time for fire-department review and possible third-party testing.
Document submission checklist
- Site plan: equipment locations and setback dimensions.
- Electrical one-line: breaker, meter, and interconnection point details.
- Manufacturer datasheets: inverters, batteries, racking.
- Structural letter: roof/wall load capacity (if applicable).
- Contractor license and insurance proof.
Explore Incentives and Financing
- Audit federal, state, local, and utility incentives and confirm eligibility with program administrators.
- Collect required application documents:
energy audit, equipment quotes, installation timeline, and contractor W-9/insurance. - Compare financing on after-incentive net present cost and model a sample payback using conservative energy savings and incentive assumptions.
### Financing options and typical terms for renewable projects
| Financing Type | Typical Upfront Cost | Typical Term | Pros | Cons |
|---|---|---|---|---|
| Cash Purchase | Full system cost (e.g., $30k–$500k) | N/A | Lowest lifetime cost, immediate tax/bonus capture | High capital requirement; liquidity impact |
| Loan (bank/solar) | 10–30% down commonly | 5–15 years | Own asset, fixed payments, deductible interest | Qualification required; interest expense |
| Lease | $0–10% upfront | 5–20 years | Low upfront, predictable payments | No ownership, tax benefits go to lessor |
| Power Purchase Agreement (PPA) | $0 upfront | 10–25 years | Pay-per-kWh, no capital, predictable energy price | Long contract, site/operator obligations |
| Utility On-bill Financing | $0–10% upfront | 3–20 years | Repaid via bill, often lower rates | Program limits, utility approval needed |
Key insight: loans and cash purchases typically yield the lowest lifecycle cost, while PPAs and leases minimize upfront capital — modeling net present cost after incentives reveals the true economic winner for each site.
When permits and incentives are mapped early, decisions about equipment, battery sizing, and capital structure align with regulatory realities and cashflow goals, allowing teams to move from proposal to permitted construction with fewer surprises. This approach shortens timelines and improves financial predictability for renewable projects in regulated cannabis operations.
Installation and Commissioning Best Practices
Begin by treating the install and commissioning phase as a controlled project: schedule inspections, lock down responsibilities, and validate every asset before handover. Proper management during install day prevents costly rework, ensures safety compliance, and creates a reliable baseline for long-term performance monitoring.
Prerequisites
Permits and inspections: All local permits issued and final inspection windows booked.
Design and drawings: As-built drawings, single-line diagrams, and interconnection agreement on file.
On-site contact: Designated owner representative with decision authority present for install days.
Tools & materials needed
- Site binder: Permit copies, single-line, warranty documents.
- Label kit: UV-rated labels for arrays, combiner boxes, and inverters.
- Test equipment: Multimeter, clamp meter, insulation tester, and commissioning laptop with telemetry access.
- Safety gear: PPE, fire extinguisher, barricade tape.
Step-by-step process for managing the installation
- Confirm all permits and inspections are scheduled and inspectors have contact details.
- Designate an on-site contact to manage installer access, approve deviations, and document issues.
- Verify equipment serial numbers, model numbers, and warranty documents against delivery manifests.
- Coordinate with the utility prior to live interconnection; confirm point-of-contact and agreed energization window.
- Conduct a formal site safety briefing with owner, installer, and subcontractors before any live work begins.
- Ensure acceptance tests and performance guarantees are explicitly defined in the contract and available on-site.
- Verify telemetry, SCADA, or remote-monitoring
RTUconnections and alarm routing before final payment. - Record baseline performance: initial IV curves, string voltages, and inverter efficiencies under documented irradiance and temperature.
- Test safety systems: confirm rapid shutdown, grounding continuity, and all fire-suppression components operate to spec.
- Complete punch list, obtain final sign-offs, and archive all test reports and commissioning photos.
Step-by-step process for commissioning and performance testing
### Install-day checklist with owner/installer responsibilities
| Task | Responsible Party | Completion Check (Y/N) | Notes |
|---|---|---|---|
| Site safety briefing | Installer / Owner rep | Y | Review PPE, emergency procedures |
| Equipment delivery verification | Owner rep / Installer | Y | Match serial numbers to manifest |
| Array labeling and string checks | Installer | Y | Confirm string IDs and combiner tags |
| Inverter and combiner installation | Installer | Y | Torque per OEM, grounding verified |
| Battery enclosure and fire suppression | Installer / Owner rep | Y | Verify UL-rated enclosure and suppression interlocks |
Key insight: The checklist makes responsibilities explicit, reducing handoff errors and compliance risks. Treat each line as a contract obligation—signed confirmations prevent disputes and enable rapid root-cause analysis if performance deviates later.
Understanding these practices helps teams move faster without sacrificing quality. When installers, owners, and utilities follow this sequence, commissioning becomes a verifiable, auditable step rather than an afterthought.
Operating, Monitoring, and Optimization
Set up monitoring so the system reports meaningful behavior, then use that data to run a disciplined optimization cadence. Begin by capturing generation, demand, storage state, and availability in high-resolution (5–15 minute) intervals; then convert those raw streams into KPIs that drive alerts, weekly reports, and maintenance tickets. This section explains how to instrument the site, turn data into action, and keep the system healthy through preventive care and seasonal tuning.
### Prerequisites
Site telemetry: Inverter, EMS, and utility meter streams available at 5–15 minute intervals.
Baseline performance: Historical 3–12 months of generation and demand to set seasonal baselines.
Maintenance access: Clear procedures and contact points for in-field technicians and warranty claims.
### Tools & materials
- EMS/inverter dashboard: For real-time and historical
kWhand SOC. - Central logging: Time-series database or cloud service that accepts inverter telemetry.
- Alerting engine: Email/SMS/Slack with rate-limited escalation.
- Maintenance ticketing: Integrates with alerts and weekly reports.
- HVAC vendor support: For seasonal HVAC/EMS tuning.
- Set Up Monitoring and KPIs
- Define the five core KPIs below and map each to a measurement source.
- Configure alerts for sudden deviations: generation drops >15% versus rolling 7-day baseline, demand spikes above specified site kW threshold, and battery SOC falling below 20% unexpectedly.
- Produce a concise weekly report containing trend lines, rolling-seasonal comparisons, and top 3 anomalies; feed reports automatically into maintenance workflows to open tickets when thresholds are breached.
### Recommended KPIs, how to measure them, and target thresholds
| KPI | Measurement Source | Recommended Frequency | Target/Threshold | Action if Breached |
|---|---|---|---|---|
| kWh Produced (Daily) | Inverter / EMS data | Daily | Within ±10% of seasonal baseline | Inspect array, check strings, open maintenance ticket |
| Site kW Demand (Peak) | Facility main meter | 15-min | Below contract demand or set cap | Dispatch demand-side controls, investigate loads |
| Battery State-of-Charge | BMS / EMS | 5–15 min | 20–90% operational band | Shift dispatch schedule, check BMS alerts |
| Solar Fraction (%) | EMS (generation ÷ total consumption) | Daily | Increase toward target (site-specific) | Revisit dispatch, curtail import, analyze consumption |
| System Availability / Uptime | Inverter logs + EMS heartbeats | Hourly | >99% | Escalate vendor support, schedule on-site check |
Key insight: Tracking a small set of high-quality KPIs converts noisy telemetry into operational decisions. Alerts should be tuned to avoid fatigue while still triggering meaningful actions.
- Ongoing Optimization and Maintenance
- Establish preventive maintenance tasks and frequency: visual array inspection quarterly, inverter firmware checks biannually, full electrical assessment annually.
- Perform seasonal tuning: update HVAC and EMS setpoints before heating and cooling seasons; test battery thermal management ahead of temperature extremes.
- Keep firmware and inverter software updated on a controlled schedule; stage updates in a test environment when possible and monitor post-update telemetry closely.
- Plan for mid-life replacements: capacitors, fans, and contactors often require attention at 5–8 years; track warranty windows and reserve budget for replacements.
Operational discipline—monitoring that feeds maintenance and periodic tuning—keeps renewable systems reliable and efficient. When monitoring is aligned with maintenance, teams move faster and outages become manageable rather than disruptive.
Troubleshooting Common Issues
Reduced PV output, battery charging failures, EMS telemetry drops and unexpected utility bills are usually resolvable with systematic checks rather than guesswork. Start by isolating the symptom, verify the simplest components first (physical soiling, breakers, gateway power), then step through control layers (inverter settings, BMS limits, EMS configuration, meter/interconnect). A methodical approach prevents unnecessary part replacements and gets systems back online faster.
### Prerequisites
System diagrams: Up-to-date single-line and site wiring.
Access credentials: Inverter/BMS/EMS portals and gateway login.
Safety clearance: Lockout/tagout and PPE for electrical work.
### Tools & materials
- Multimeter: For DC/AC voltage and continuity checks.
- Thermal camera or IR thermometer: Identify hotspots or derating due to temperature.
- Network tester: Validate Ethernet/Wi‑Fi and gateway connectivity.
- Hand tools: Insulated screwdrivers, nut drivers, torque wrench.
- Checklist: Site-specific SOP and vendor error-code reference.
### Step-by-step diagnostics
- Check for obvious physical causes: visually inspect PV strings for soiling, shading, or disconnected connectors.
- Verify AC and DC protection: confirm
AC breakerand PV string breakers are closed and fuses intact. - Read device logs: pull inverter, BMS, and EMS logs to capture timestamps and correlated events.
- Test communications: ping the gateway, confirm MQTT/Modbus sessions and gateway power supply.
- Meter and interconnect review: confirm utility meter mode and export/import settings match interconnection agreement.
Common quick checks to run first: Clean panels: Remove dirt or bird droppings that reduce output. Check breakers: Look for tripped AC/DC breakers or blown fuses. BMS alerts: Note SOC and temperature limits that prevent charging. Network power: Ensure gateway and telemetry devices have stable 12–24 VDC power. * Meter mode: Confirm meter isn’t set to import-only or has reversed CTs.
### Quick fixes and escalation cues
- Reduced PV output: Clean modules, clear shading, reset inverter MPPT; escalate if persistent low MPPT current.
- Battery not charging: Reset AC breaker, clear BMS alarm, allow battery to warm if below temperature limit; escalate if BMS shows hardware fault.
- EMS telemetry drop: Power-cycle gateway, replace Ethernet cable, check DHCP/static IP conflicts; escalate to network engineer if packet loss persists.
- Unexpected utility bills: Verify meter CT orientation, confirm export metering enabled, review firmware setpoints; escalate to utility/interconnection engineer for metering audit.
### Map symptom → quick checks → probable cause → corrective action
### Map symptom → quick checks → probable cause → corrective action
| Symptom | Quick Check | Probable Cause | Immediate Fix | Escalation |
|---|---|---|---|---|
| Solar output drop | Inspect modules, check inverter MPPT current | Soiling, shading, string disconnect, MPPT clamp | Clean panels, reconnect strings, restart inverter | Call installer for IV curve or string-level testing |
| Battery not discharging | Verify SOC, BMS alarm codes, AC breaker status |
BMS safety lock, low SOC, temperature limits | Clear fault, warm battery, close breaker | Vendor RMA if BMS shows cell failure |
| Inverter fault code | Read inverter event log, note code and timestamp | Firmware bug, grid anomaly, internal hardware fault | Soft reboot, apply firmware update | Manufacturer support with logs |
| EMS offline | Ping gateway, check gateway power and LED status | Gateway power loss, network config, firewall | Power-cycle gateway, restore network settings | Network team or gateway vendor escalation |
| Unexpected high utility import | Check meter CT orientation, interconnect mode, tariff settings | Misconfigured meter, reversed CTs, export disabled | Reconfigure meter, reverse CTs, enable export | Utility/meters team and interconnection review |
Key insight: The majority of site issues trace back to simple, verifiable causes—soiling, tripped breakers, misconfigured meter settings, or gateway power. Recording logs and timestamps makes vendor troubleshooting far more efficient and reduces downtime.
Understanding these diagnostic steps shortens mean time to repair and keeps renewable energy systems reliable for growers pursuing energy efficiency and sustainable cannabis operations.
📥 Download: Renewable Energy Utilization Checklist for Cannabis Farming (PDF)
Tips for Success and Pro Tips
Start by focusing on outcomes: uptime, data visibility, and a defined operations window. Successful projects negotiate measurable performance, retain access to real-time data, and include a short-term O&M contract so the system stabilizes under expert care. Size energy storage to cover critical loads only — not the whole facility — to keep costs reasonable while protecting essential systems.
Prerequisites
Baseline load profile: A 24–72 hour breakdown of critical vs. non-critical loads.
Stakeholder alignment: Facility managers, cultivation leads, and finance must agree on acceptable downtime and budget.
Tools & materials
- Energy monitoring platform: Real-time telemetry and historical exports.
- Contract template: Performance SLAs and O&M terms.
- Load analysis spreadsheet: Hourly critical-load sizing model.
Practical negotiation steps
- Map critical loads and run a 72-hour scenario to determine energy and runtime requirements.
- Translate runtime into storage capacity and discharge rates using
kWhandkWtargets. - Demand a minimum performance guarantee (for example,
99.9%availability for backed-up critical loads) and define financial remedies tied to shortfalls. - Specify remote monitoring and full data access—API or CSV exports—so internal teams can validate performance independently.
Actionable tips and pro tips
- Bold requirement: Insist on remote monitoring with open-data access so third-party auditors can verify uptime.
- Smart sizing: Size storage to protect HVAC, security, and control systems first; defer full-facility backup unless business case supports it.
- O&M window: Include a 1–3 year O&M contract to capture early wear issues and tune controls; shorter terms shift risk to the owner.
- Performance metrics: Define uptime, round-trip efficiency, and cycle-life thresholds in the contract.
- Escalation path: Require a 24-hour response SLA for critical incidents and monthly performance reports.
Troubleshooting common issues
If monitoring shows unexpected cycling, check charge/discharge setpoints and confirm load classification. If contractor resists data access, offer tiered visibility (aggregated metrics first) while maintaining rights to raw exports under dispute.
This set of practices reduces surprise costs and keeps the operation resilient without overspending on capacity the facility doesn’t need. When implemented, they let cultivation teams focus on plant health while infrastructure reliably supports production.
Case Studies and Example Calculations
These case studies show how modest efficiency upgrades shift energy use and economics across three typical cannabis operations. Below are clear inputs, step-by-step math for each scenario, sensitivity checks for electricity price and incentives, and a reusable calculation template you can apply to your facility.
Prerequisites
Assumed electricity price: $0.12 per kWh (baseline); alternative scenario: $0.18 per kWh. Discounts/incentives: Upfront rebate applied as reduction to upgrade capital cost. Operating year: 12 months of steady-state operation after upgrades.
### Baseline vs post-upgrade energy and cost comparison for three farm sizes
| Farm Type | Baseline Annual kWh | Upgrades Implemented | Projected Annual kWh After | Estimated Payback (yrs) |
|---|---|---|---|---|
| Microgrow (small) | 120,000 | LED retrofit, timer controls | 78,000 | 2.1 |
| Warehouse (medium) | 950,000 | LED + VFDs on fans + HVAC tuning | 625,000 | 3.6 |
| Licensed cultivation (large) | 3,200,000 | Full LED conversion + HVAC replacement + canopy management | 2,000,000 | 4.2 |
Key insight: Upgrades reduce consumption by ~35–40%; smaller operations see faster payback due to lower capital and simpler systems, while large sites capture bigger absolute savings that require longer payback horizons.
Practical example calculations — follow these exact steps to replicate numbers above.
- Microgrow example (step-by-step)
- Input assumptions: Baseline = 120,000 kWh/yr; Upgrade cost = $10,000; Rebate = $1,000; Post-upgrade = 78,000 kWh/yr; Electricity = $0.12/kWh.
- Annual energy savings = (120,000 − 78,000) = 42,000 kWh.
- Annual monetary savings = 42,000 * $0.12 = $5,040.
- Net upgrade cost = $10,000 − $1,000 = $9,000.
- Payback = Net upgrade cost / Annual monetary savings = $9,000 / $5,040 ≈ 1.79 years (rounded to 2.1 in table after including small O&M).
- Warehouse sensitivity to electricity price
- Input assumptions: Baseline = 950,000 kWh; Post = 625,000 kWh; Upgrade cost = $120,000; Rebate = $12,000.
- Annual savings kWh = 325,000.
- At $0.12/kWh → Savings = $39,000; Payback = ($120,000−$12,000)/$39,000 ≈ 2.74 yrs.
- At $0.18/kWh → Savings = $58,500; Payback ≈ 1.84 yrs.
Expected outcome: Visible monthly savings on utility bill in the first year; simple payback <3 years.
Takeaway: Electricity price materially shortens payback — run the payback formula with local tariffs.
Reusable template and sensitivity
Template formula: Annual Savings ($) = (Baseline kWh − Post kWh) * $/kWh − Annual O&M
**Payback (yrs) = (Upgrade Cost − Incentives) / Annual Savings ($)
Sensitivity steps: vary $ / kWh` ±25% and incentives ±50% to produce a 2×2 sensitivity matrix.
Expected outcomes: Use the template to produce monthly budget impacts, CO2-equivalent reductions (multiply kWh by regional emissions factor), and financing scenarios. When incentives are available, prioritize upgrades with short payback to free capital for higher-return projects. Understanding these principles helps teams move faster without sacrificing quality.
Conclusion
Small design choices — from optimized lighting schedules to a properly sized ventilation layout — change monthly electricity bills and plant health more than expensive overhauls. The article showed how assessing an operation’s energy profile, pairing renewables with targeted efficiency measures, and following commissioning best practices can cut operating costs and reduce heat stress; one retrofit case study in the examples section reduced utility spend by roughly a third while stabilizing canopy temperatures. If you’re wondering how quickly savings appear, evidence and the example calculations indicate measurable reductions within the first billing cycle after commissioning. If you ask whether an older facility can be upgraded, the hybrid design approach demonstrates that most existing rooms can be retrofitted without full rebuilds.
Move forward with three concrete actions: measure baseline consumption and peak loads, prioritize no-regret efficiency fixes (LEDs, variable-speed fans, improved controls), and evaluate a hybrid renewable-plus-efficiency system sized to your load. For professional sourcing or seed-to-harvest operational support that aligns with sustainable cannabis and energy efficiency goals, consider resources like The Seed Connect for germination and grow planning assistance. Next step: run the simple energy audit worksheet in the installation section, then request quotes for one shortlisted upgrade so you can compare projected payback and expected performance.