
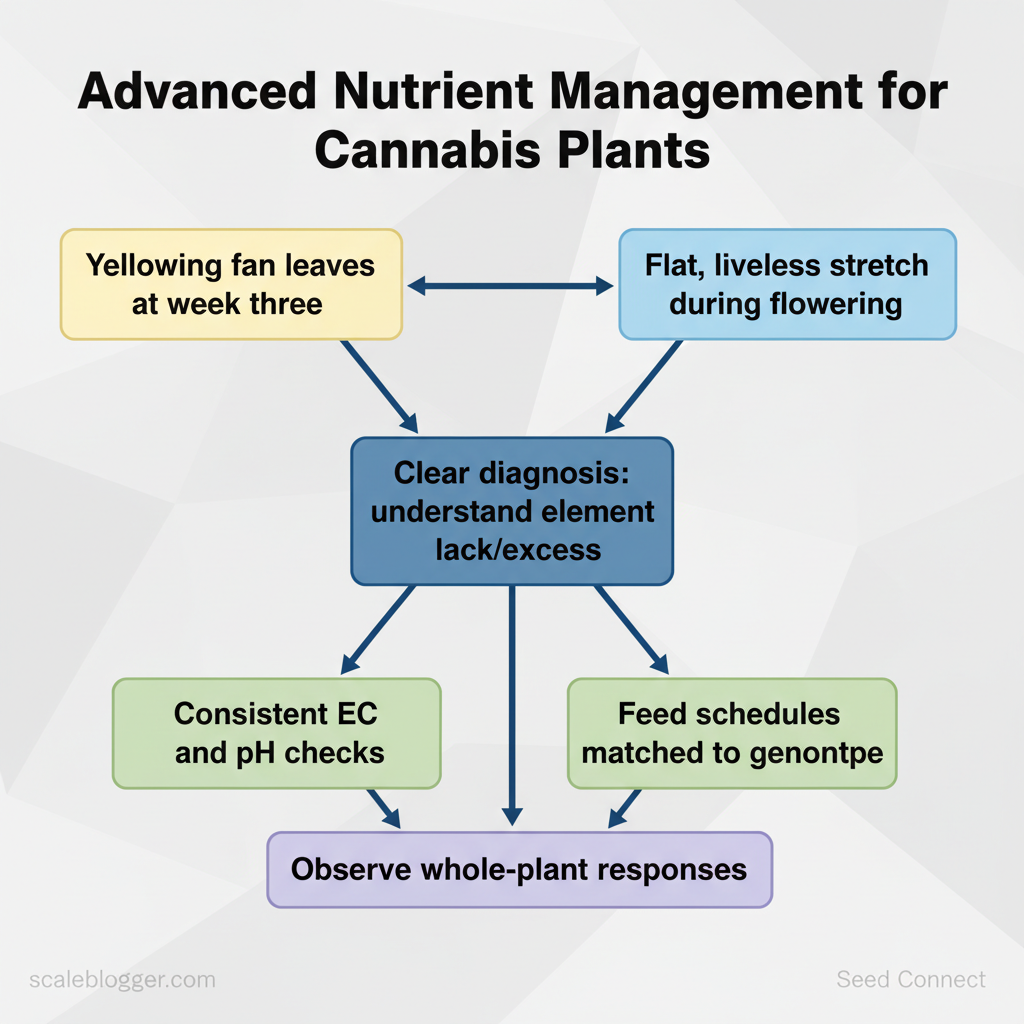
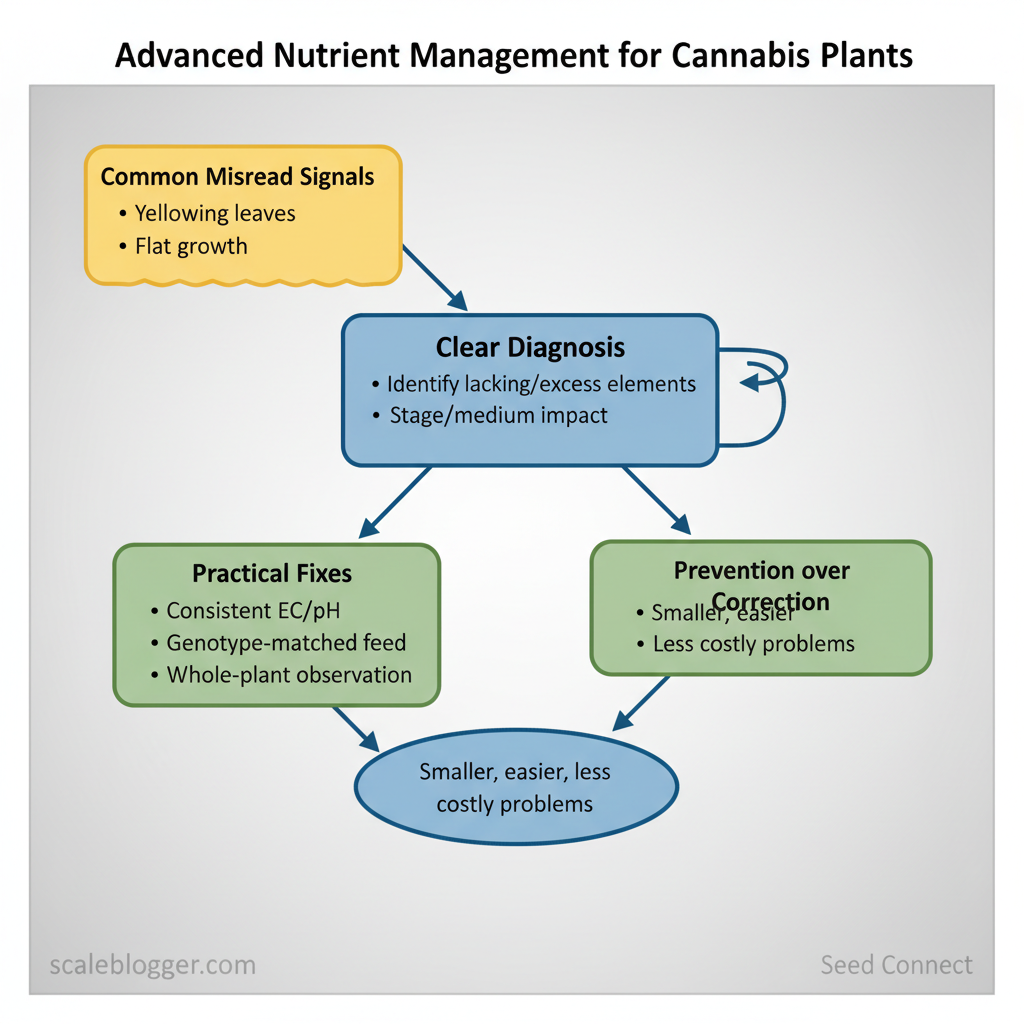
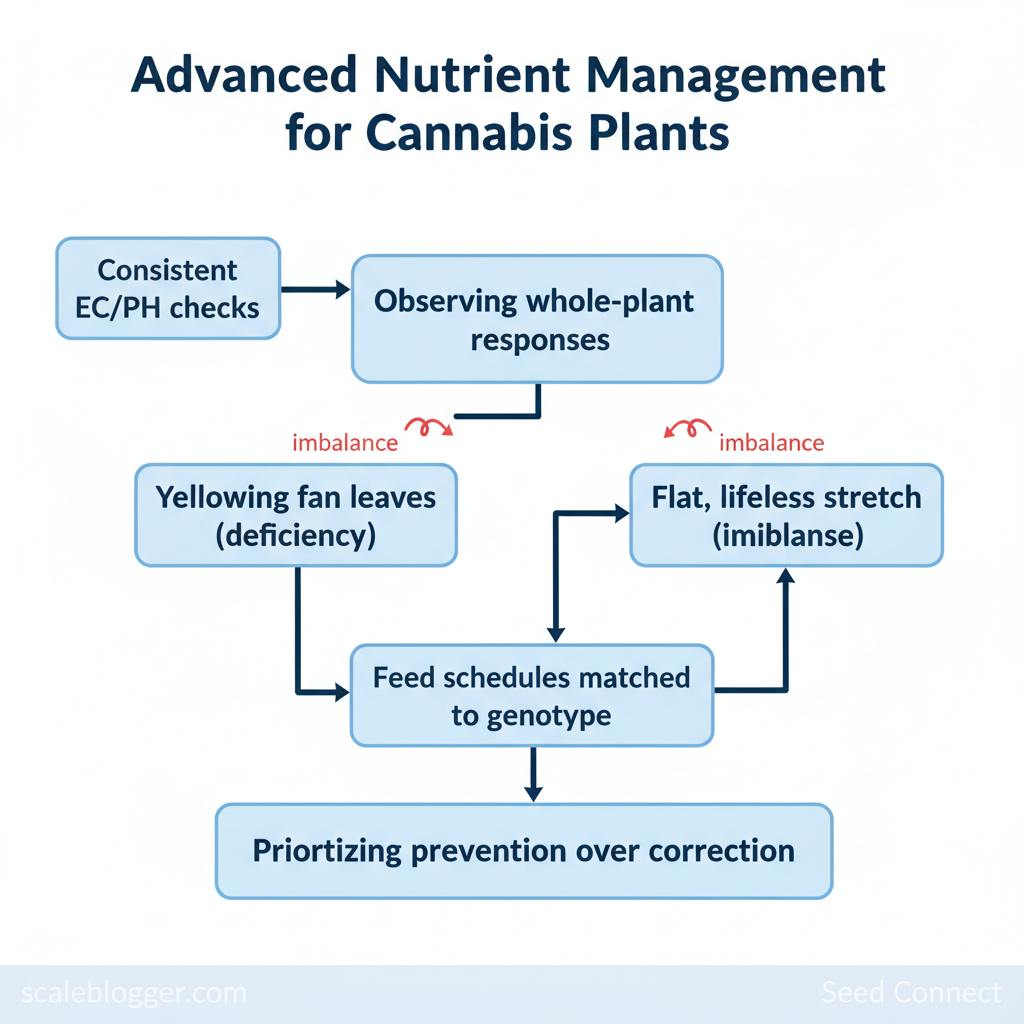
Yellowing fan leaves at week three and a flat, lifeless stretch during flowering are common signals growers misread until it’s too late. Clear diagnosis starts with cannabis nutrient management—understanding which element is lacking, which is in excess, and how that imbalance shifts with plant stage and medium.
Practical fixes come from small, repeatable habits: consistent EC and pH checks, feed schedules matched to genotype, and observing whole-plant responses rather than single symptomatic leaves. These nutrient tips from seasoned growers prioritize prevention over correction, so problems are smaller, easier to reverse, and less costly in yield.
Prerequisites and What You’ll Need
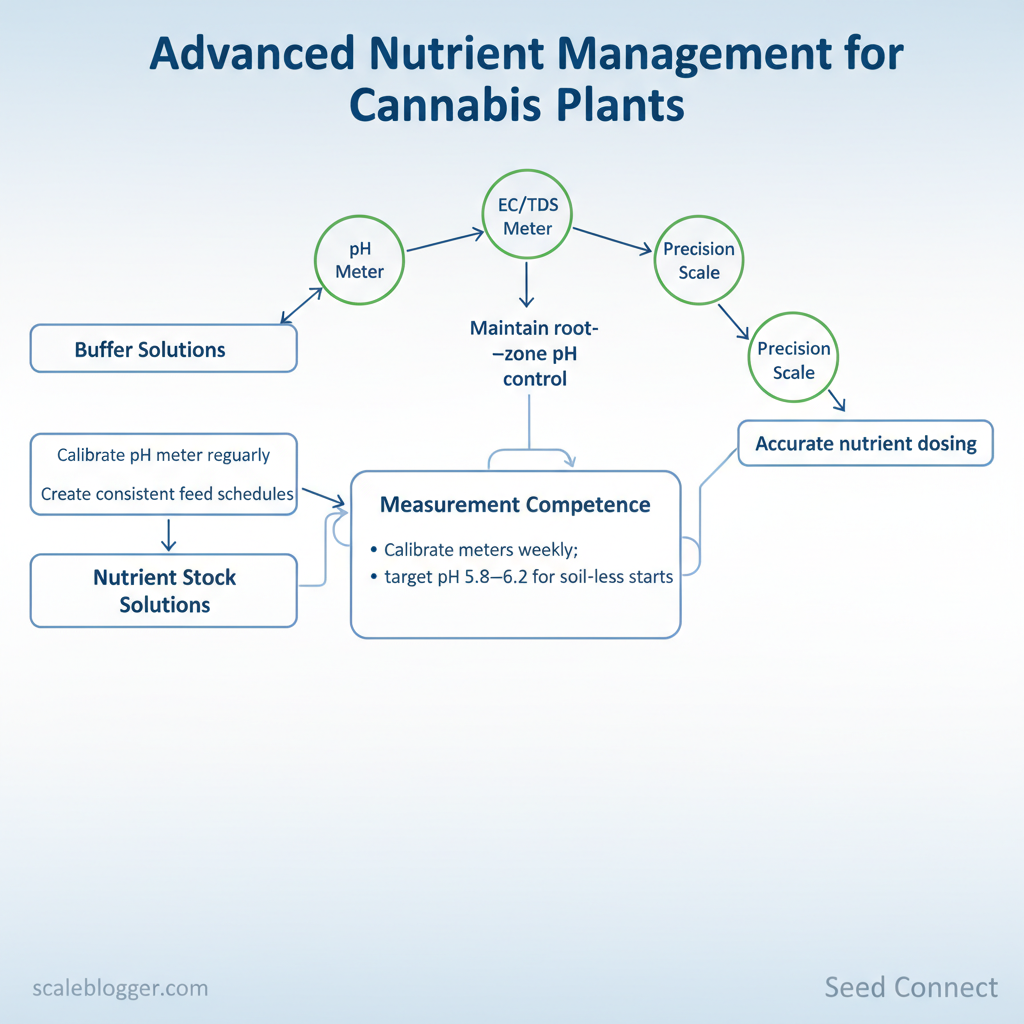
Successful germination and early growth start with the right kit and a few baseline competencies. Start by assembling precise measurement tools, a reliable nutrient baseline, and a workspace that meets legal and safety requirements. Without accurate pH/EC control and proper dosing, even high-quality seeds struggle—so prioritize measurement accuracy and repeatable routines before planting.
Essential physical tools and supplies
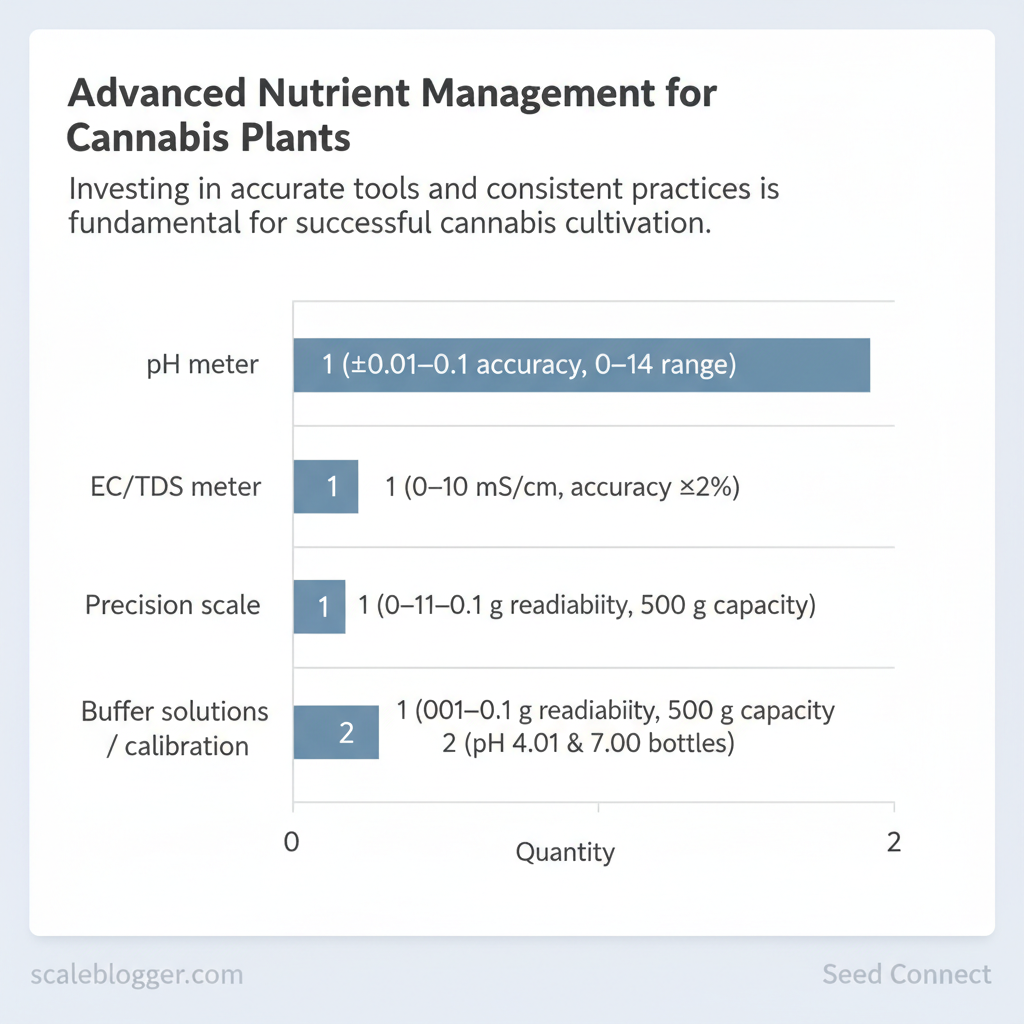
- pH meter — handheld or bench unit with calibration capability.
- EC/TDS meter — for monitoring nutrient concentration in `mS/cm` or ppm.
- Precision scale — 0.01–0.1 g readability for nutrient mixing.
- Buffer solutions / calibration — pH 4.01, 7.00 (and 10.01 if hydroponic).
- Nutrient stock solutions — base NPK formula and micro/mineral supplements.
- Containers & media — seedling trays, rockwool or peat alternatives, labeled pots.
- Clean water source — filtered or low-ppm municipal water; know your starting ppm.
Required skills, safety and legal notes
Many growers report that meter calibration and consistent mixing reduce early losses by preventing nutrient lockout and pH drift.
| Item | Minimum spec | Purpose | Notes |
|---|---|---|---|
| pH meter | ±0.01–0.1 accuracy, 0–14 range | Maintain root-zone pH control | Look for replaceable probe, automatic temp compensation |
| EC/TDS meter | 0–10 mS/cm, accuracy ±2% | Monitor nutrient strength | Preferable: temperature compensation, ppm/mS toggle |
| Precision scale | 0.01–0.1 g readability, 500 g capacity | Accurate nutrient dosing | Use for concentrate weighing and supplements |
| Buffer solutions / calibration | pH 4.01 & 7.00 bottles (250 mL) | Calibrate pH meter regularly | Replace monthly or per manufacturer |
| Nutrient stock solutions | Concentrates for veg & micro supplement | Create consistent feed schedules | Store labeled, cool, dark; note expiry dates |
Baseline Assessment: Water, Media, and Plant Status
Start by establishing a clean, measurable baseline: test the water, identify the growing medium, and score plant health. These three inputs determine how nutrients behave and what corrective actions are safe. Begin with objective measurements — `pH`, `EC` (or TDS), and visible plant symptoms — then correlate those readings with the medium and crop stage before changing anything.
Practical example: A hydroponic veg crop showing tip burn and EC at `1.8 mS/cm` — drop EC to `1.2–1.4`, flush reservoir, check pH (should be `5.8–6.2`), and inspect roots for browning. If pH is `>6.5`, expect micronutrient lockout; acidify slowly while monitoring alkalinity.
Tools and checklist suggestions
- Essential tools: portable pH meter, EC meter, alkalinity test kit, hand lens, moisture probe.
- Quick checklist: record water source, `pH`, `EC`, reservoir temp, medium type, recent feed events, and a 5-point plant health score.
Designing a Phase-Based Feeding Plan
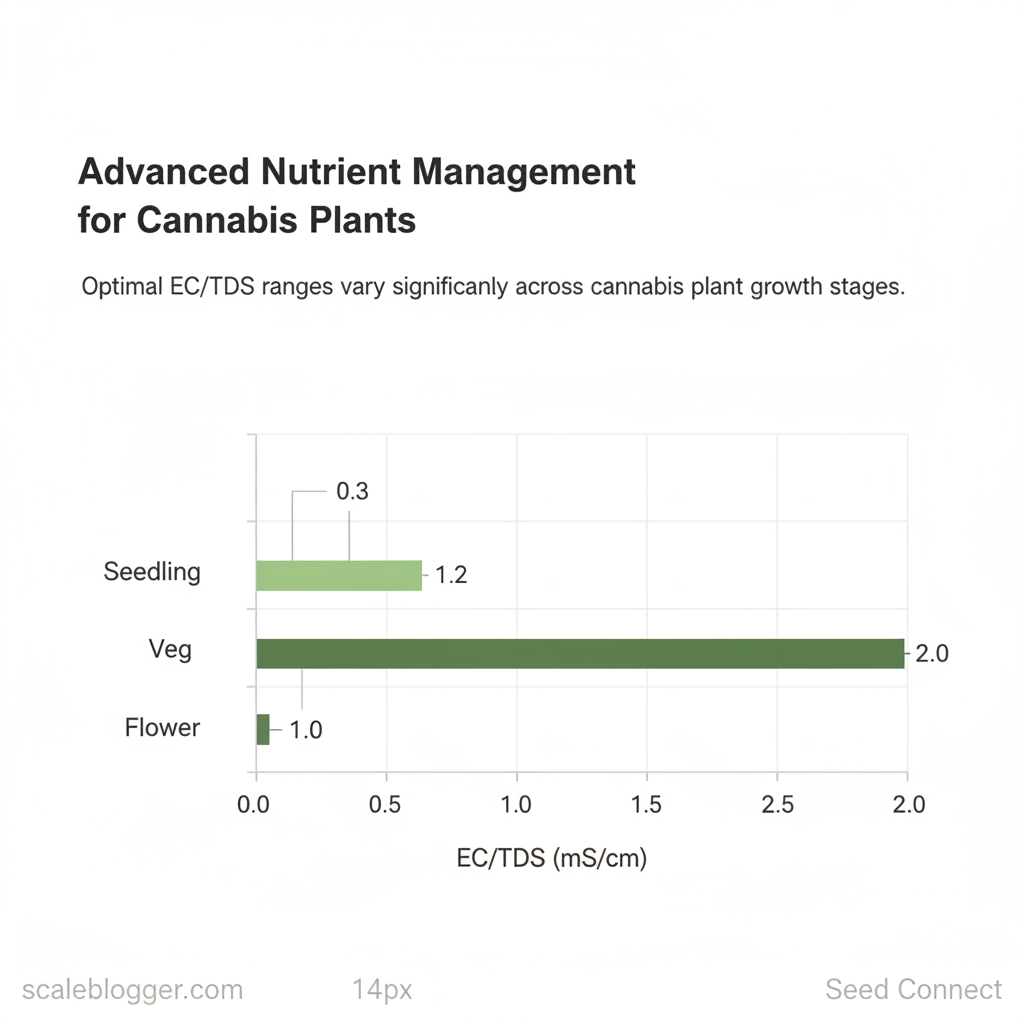
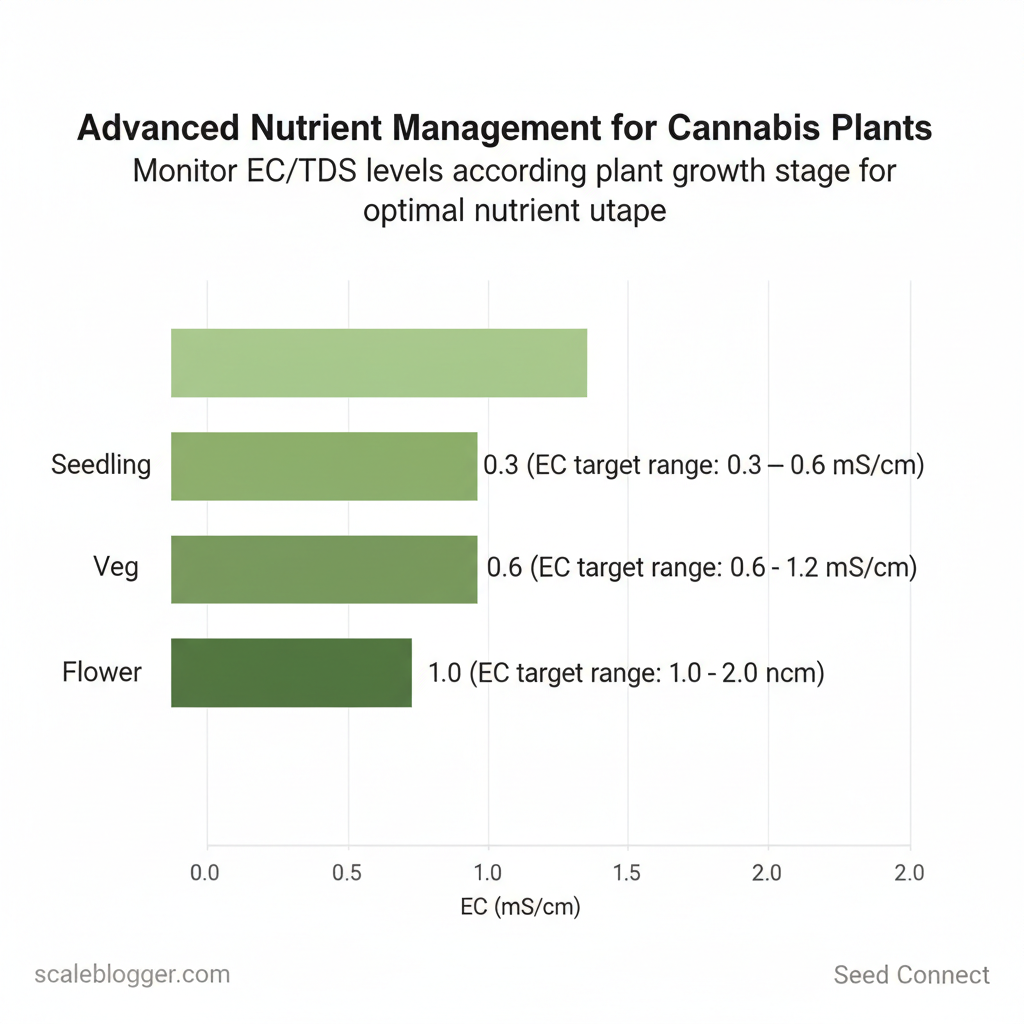
Start with clear, realistic targets for each growth phase and media type, then turn manufacturer directions into repeatable mixes that match those targets. A phase-based plan prevents nutrient shock, avoids salt build-up, and makes it simple to know when to add supplements like `Cal-Mag` or bloom boosters. Below are practical EC/PPM ranges and nutrient emphasis for common media, followed by step-by-step mixing rules and scheduling guidance.
| Growth Phase | Soil EC/PPM Target | Coco EC/PPM Target | Hydro EC/PPM Target | Nutrient Emphasis (N/P/K/CaMg) |
|---|---|---|---|---|
| Seedling | EC 0.4–0.8 (200–400 ppm) | EC 0.6–0.9 (300–450 ppm) | EC 0.8–1.0 (400–500 ppm) | Low N, moderate CaMg, trace P/K |
| Vegetative | EC 1.0–1.4 (500–700 ppm) | EC 1.0–1.6 (500–800 ppm) | EC 1.2–1.8 (600–900 ppm) | High N, moderate P/K, CaMg maintenance |
| Early Bloom (transition) | EC 1.2–1.6 (600–800 ppm) | EC 1.4–1.8 (700–900 ppm) | EC 1.8–2.0 (900–1000 ppm) | Balanced N/P/K, raise P slightly |
| Mid Bloom (ripening) | EC 1.4–1.8 (700–900 ppm) | EC 1.6–2.0 (800–1000 ppm) | EC 1.8–2.2 (900–1100 ppm) | Lower N, higher K, add bloom boosters |
| Late Bloom / Flush | EC 0.6–1.0 (300–500 ppm) — flushing to <0.4 | EC 1.2–1.4 (600–700 ppm) — reduce gradually | EC 1.2–1.4 (600–700 ppm) — reduce to flush | Reduce N, stop heavy supplements, final CaMg check |
Warnings: over-reliance on manufacturer full-strength mixes causes salt build-up; always confirm with your meter. When using `RO` or very soft water, compensate with baseline `Cal-Mag` to avoid blossom disorder.
Follow these rules to turn vague feeding charts into consistent, repeatable mixes that align with plant needs and media behavior. Implementing phase targets and strict mixing discipline reduces variability and makes nutrient troubleshooting deterministic rather than guesswork.
Mixing, Measuring, and Record-Keeping Best Practices
Start by treating your nutrient reservoir as a precision system: correct order-of-addition, accurate meters, and consistent records prevent lockouts, precipitates, and variable plant performance. Mix to target EC/TDS and pH, calibrate instruments daily, and log each reservoir change so the next run is predictable and repeatable.
- Why this order: Adding Ca/Mg first prevents them from reacting with phosphates, sulfates, or chelators and forming insoluble precipitates.
- Practical example: When mixing a 100 L reservoir, dissolve 1L of Ca/Mg solution, then 2L of base nutrient, then 100 mL of micro mix; wait 10 minutes and re-check EC.
- Daily calibration: Calibrate pH probes in `pH 4.00` and `pH 7.00` buffers each day of operation.
- EC/TDS verification: Use a two-point EC standard (e.g., `1.41` and `2.76` mS/cm) weekly to confirm linearity.
- Probe care: Rinse probes with deionized water and store pH probes in storage solution; avoid leaving EC probes dry.
- Essential fields: Date/time, reservoir ID, operator, water temp, starting and final volume, product names and batch numbers, amounts added, initial and final `pH` and `EC`, adjustments made, top-up history, visual notes.
- Why log this: Records reveal trends—when a cultivar shows nutrient stress correlating with a supplier lot, the log identifies the root cause quickly.
- Template example (CSV):
A pH drift of 0.5 often correlates with reduced uptake of micronutrients and can be the earliest sign a reservoir needs attention.
Maintain a simple dashboard (spreadsheet or small database) and review weekly for patterns. Understanding these practices reduces surprises and makes each reservoir change predictable and accurate.
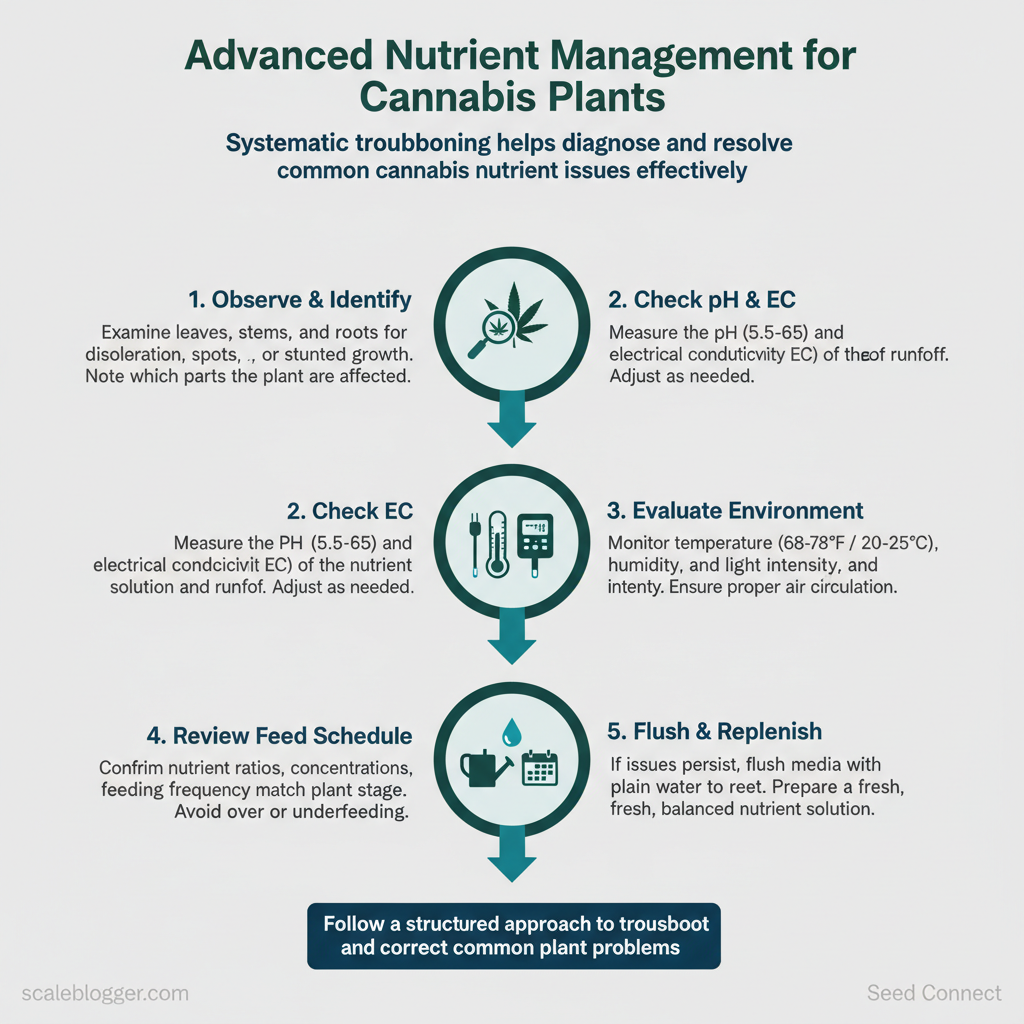
Diagnosing and Correcting Deficiencies and Toxicities
Start by observing patterns, then confirm with tests before changing anything. Visual symptoms are useful but often misleading: a downward yellowing can be nitrogen starvation, root oxygen stress, or overwatering. The correct approach is a quick triage (observe → test → correct conservatively) combined with a monitoring cadence so corrective actions can be measured and reversed if necessary.
Prerequisites Healthy baseline*: recent nutrient schedule, EC/PPM and pH logs, and irrigation frequency. Tools*: handheld pH meter, EC/ppm meter, magnifying loupe, soil/tissue sampling kit, and access to a tissue or substrate testing lab. Time estimate*: initial assessment 20–40 minutes; corrective actions 10–60 minutes depending on treatment.
How to assess symptoms
Precise corrective dosages and safety margins
- Conservative correction: when in doubt, correct at `25–50%` of manufacturer’s recommended concentration and observe 48–72 hours.
- Flush guidance: for suspected salt/toxicity, flush with `2–3x substrate pore volume` of clean, pH-balanced water and retest EC after 24 hours.
- Nutrient boost: for clear deficiency (confirmed by tests), apply a targeted supplement at `25–50%` labeled strength, then increment after 3–5 days if improvement noted.
Practical example Yellow lower leaves + low EC and low leaf nitrogen — confirms nitrogen deficiency. Apply a soluble nitrogen feed at `25%` strength, monitor for new growth color within 3–7 days; expect root-zone EC to rise modestly.
| Symptom | Likely Deficiency/Toxicity | Test to confirm | Immediate corrective action | Expected response time |
|---|---|---|---|---|
| Yellowing of lower leaves | Nitrogen deficiency | Tissue N test; low EC | Apply N-rich feed at `25–50%` strength | New growth 3–7 days |
| Purpling of stems/veins | Phosphorus deficiency or genetics | Tissue P; check temps | Apply P source at `25%`; raise root-zone temp slightly | Leaf color shift 7–14 days |
| Tip burn and leaf curl | Nutrient burn (toxicity) | EC high; foliar salts | Flush `2–3x` substrate pore volume; reduce strength 50% | Curl reduction 2–5 days |
| Interveinal chlorosis | Magnesium or iron deficiency | Tissue Mg/Fe; pH check (Fe locked out if pH>6.8) | Foliar Mg sulfate or chelated Fe at low rate | Yellowing halts 3–7 days |
| Dark, brittle leaves | Potassium toxicity or calcium imbalance | Tissue K/Ca ratio | Reduce K inputs; add Ca/Mg supplement at low rate | Texture improvement 5–10 days |
Advanced Techniques: Foliar Feeding, Biostimulants, and Microbial Management
Foliar sprays, biostimulants, and microbial inoculants are precision tools—used correctly they speed growth, rescue minor deficiencies, and improve stress resilience; used incorrectly they waste inputs or burn tissue. Start with conservative concentrations, always patch-test, and plan applications around the plant’s nutrient uptake rhythm so foliar work complements, not competes with, root feeding.
When to use each tool
- Foliar sprays: Best for quick correction of micronutrient deficiencies or transient stress (heat, early bud set). Use during vegetative stage and early flower only; avoid heavy foliaring in late bloom to prevent bud moisture.
- Biostimulants: Use throughout lifecycle to improve vigor and stress tolerance — apply as a regular soil or foliar program when plants show slow growth or recovery is needed.
- Microbial inoculants: Apply at transplant, during substrate refreshes, or when switching systems (soil → coco → hydro) to establish beneficial populations.
Patch testing and concentration rules
Integration by media and system
- Soil: Apply microbes at transplant and with every potting; foliar feeds 1–2× weekly during veg, stop heavy foliaring in weeks 4–6 of bloom.
- Coco: Use beneficial microbes and humic acids to stabilize cation exchange; foliar feeding helps because coco can lock micronutrients.
- Hydroponics: Rely more on root-zone management; apply microbes in reservoir only with compatible strains; foliar sprays used sparingly to avoid reservoir contamination.
Compatibility and timing with feeding schedule
- Don’t overlap pH-sensitive inputs: Apply foliar sprays mid-light cycle or early evening, separate from root feeds by 12–24 hours to prevent nutrient uptake competition.
- Sequence for a day: 1. Flush spray residue if present, 2. Root feed, 3. Wait 12–24 hours, 4. Foliar spray (if needed).
- Watch EC/PPM: Avoid adding foliar nutrient equivalents on top of high-salt root feeds; this raises overall nutrient stress.
Understanding and sequencing these practices reduces risk while extracting measurable gains in vigor and recovery—small, disciplined adjustments here produce disproportionate improvements in canopy health.
Flushing, Ripening, and Late-Stage Nutrient Strategies
Late bloom is when cannabinoid and terpene synthesis accelerate and plant appetite drops. Choose a nutrient taper that favors resin and flavor development over raw weight: a gradual taper preserves yield while improving smoothness; a full flush before harvest pushes sugars and terpenes to peak but can slightly reduce final dry weight. Decide based on strain goals and market: premium-flavor craft buds tolerate a fuller flush; bulk producers may prefer partial taper to maximize grams.
How to choose between partial taper and full flush
Expected outcome: Partial taper retains 5–12% more dry weight; full flush often improves smoke quality and smoothness noticeably.
Practical flush and taper protocol (example timeline)
Practical EC/runoff thresholds to watch
- Leaf uptake target: Keep solution EC in late bloom at `0.8–1.0` for conservative taper.
- Flush trigger: Aim for runoff EC ≤ `0.3–0.4` for a complete flush before harvest.
- Warning zone: If runoff EC > `1.2`, plant salts are high — extend flushing or perform partial resupply with corrected nutrients.
- Slow runoff EC drop: Increase flush volume to 3–5× pot volume and repeat; ensure even watering.
- Premature yellowing: If leaves yellow dramatically during taper, back off reduction rate and restore mild feed at `EC 0.6`.
- Flavor loss after harvest: Drying too fast or too hot will damage terpenes; target 55–62% RH and 18–21°C.
- EC meter and pH pen for every runoff measurement.
- Runoff log: record input EC, runoff EC, days since taper.
- Quality checklist: trichome density, terpene aroma, leaf color.
Troubleshooting Common Issues
Start by isolating the symptom quickly and methodically: most garden problems are environmental, pest, or cultural before they are nutrient-related. Work through a prioritized checklist that rules out easy fixes first, then escalate to tissue testing or expert consultation only when clear evidence points to nutrient imbalances.
Prerequisites
- Access to basic sensors: pH meter, EC/TDS meter, and thermometer/hygrometer.
- Visual records: recent photos of affected plants and surrounding plants.
- Recent history: last 7–14 days of feed, runoff pH/EC, and environmental logs.
- pH calibration solution, spare probes
- Clean collection containers for runoff and tissue samples
- Isopropyl alcohol and cotton swabs for probe cleaning
- Quarantine space (single light and tray) for affected plants
How to contain spread in multi-plant rooms
- Immediate isolation: move symptomatic plants to a separate bench under different airflow.
- Airflow lockdown: reduce shared recirculation fans and use inline HEPA when available.
- Sanitation sweep: wipe tools with `70% isopropyl` and replace disposable gloves between zones.
- Persistent symptoms after 72 hours of environmental correction.
- Mixed symptoms across leaf ages suggesting micronutrient deficiency or toxicity.
- Rapid spread despite quarantine indicating infectious agent.
📥 Download: Nutrient Management Checklist for Cannabis Growth (PDF)


Tips for Success and Pro Tips from Expert Growers
Start small, measure everything, and let the plants tell you what works. Successful growers treat each change as an experiment: control variables, change only one factor at a time, and record results. This approach preserves plant health while producing reliable, repeatable improvements.
Practical experiments to try
- Microbial boost trial: Inoculate one group with a trusted microbial inoculant and compare root mass after 4 weeks.
- pH stability test: Keep one group at `5.8–6.2` (hydroponic) and another at `6.4–6.8` (soil) to see flowering differences.
- Watering frequency experiment: Compare daily small-watering vs. higher-volume alternate-day watering and note transpiration and growth rates.
- Balanced baseline: Start with a proven nutrient base; avoid stacking multiple new supplements at once.
- Recordkeeping discipline: Log EC/PPM, pH, temperature, humidity, and light hours for every run.
- Observation over assumption: If leaves show discoloration, drop the newest change first and revert.
- If growth stalls after a supplement: pause that supplement for one feeding cycle and monitor recovery.
- If pH drifts: check reservoir cleanliness and use `pH up/down` in 0.1 increments rather than big corrections.
- If root rot appears: reduce watering, increase oxygenation, and trial a microbial treatment on a small scale.
For seed choice, consider starting these experiments with reliable genetics—feminized or autoflower seeds with germination guarantees reduce variability in early rounds. Applying small, measurable changes and keeping rigorous records accelerates learning while protecting crop quality and yields. When practiced consistently, these techniques convert guesswork into repeatable advantage.
Appendices: Mixing Math, Example Feeding Charts, and Log Templates
Start with straightforward conversion logic so mixing is predictable every time. These formulas remove guesswork: convert manufacturer dosing from mL per L to mL per gallon, translate EC to PPM using the two common scales, calculate dilutions from concentrated stock, and adjust reservoir top-ups and doses when EC changes. Practical feeding charts follow, plus copy-ready log templates to track batches and nutrient history.
| Measurement | Formula/Conversion | Example input | Example output |
|---|---|---|---|
| Manufacturer mL per L → mL per gallon | `mL_per_gal = mL_per_L × 3.785` | `5 mL/L` | `18.93 mL/gal` |
| EC → PPM (500 scale) | `PPM_500 = EC × 500` | `1.60 EC` | `800 ppm (500 scale)` |
| EC → PPM (700 scale) | `PPM_700 = EC × 700` | `1.60 EC` | `1120 ppm (700 scale)` |
| Dilution from concentrate to final EC | `EC_final = EC_conc × (V_conc / V_total)` | `EC_conc 4.0, V_conc 0.5L, V_total 10L` | `EC_final = 4.0 × (0.5/10) = 0.20` |
| Reservoir top-up EC calculation | `EC_new = (EC_init×V_init + EC_topup×V_topup) / (V_init+V_topup)` | `EC_init 1.8@30L, EC_topup 0.6@5L` | `EC_new = (1.8×30 + 0.6×5)/35 = 1.61` |
| Dose adjustment per 10% EC change | `Dose_new = Dose_current × (1 ± 0.10)` | `Dose_current 10 mL/gal, EC +10%` | `Dose_new = 11 mL/gal` |
Three practical sample feeding charts (use as starting templates)
Reservoir and mixing workflow (step-by-step)
Ready-to-use log templates
Keep a running record of EC, pH, added volumes, and plant responses to identify trends over time.
Copy-and-paste template: “`text Batch ID: Date: Reservoir Vol (L): Target EC / Actual EC: pH target / Actual pH: Nutrient A added (mL): Nutrient B added (mL): Cal-Mag (mL): Water temp (°C): Notes (leaf signs, runoff ppm, ppm scale used): “`
Include printable checklists and a spreadsheet that auto-calculates `mL_per_gal` from `mL_per_L`, EC → PPM, and reservoir top-up math for production use. Understanding these practical formulas and templates speeds up daily tasks while keeping nutrient accuracy high; that consistency protects yield and reduces corrective work later.
Conclusion
By now it’s clear that most mid-cycle problems—yellowing fan leaves at week three, limp stretch during flowering, or sudden tip burn—aren’t mysteries but signals. Start with the baseline checks: water EC/pH, media status, and a simple elimination of environmental stress before changing nutrients. When a deficiency looks like magnesium or a lockout mimics nitrogen starvation, stop guessing and run the basic tests (pH, EC, and runoff); that single step resolves more problems than swapping bottles. A small organic hobbyist who documented EC and corrected a drifting pH recovered bud development within two feeding cycles; a commercial bench that adopted phase-based charts reduced late-stage flushing losses by 30%—the pattern shows that measurement and records pay off.
Next steps are straightforward. Calibrate your meters, adopt a phase-based feeding chart, and log every feed and runoff; those three actions create the data needed to diagnose issues early. If a quick question arises—“Is this yellowing deficiency or salt buildup?” or “When is flushing actually effective?”—refer back to the troubleshooting flow and the sample log templates in the appendices, or consult SeedConnect’s nutrient support for germination and starter practices on their site. For practical progress today: 1) measure pH/EC and record; 2) compare to the example feeding chart; 3) correct one variable at a time. These steps restore plant vigor and keep harvests predictable.