
Supply chain surprises — delayed seeds, opaque supplier practices, and last-minute packaging changes — are the silent costs that erode margins and brand trust for growers and manufacturers. When the market demands sustainable supply chain commitments, superficial claims collapse under operational reality unless sourcing, traceability, and waste reduction are addressed together.
Start by viewing every decision through the lens of the finished cannabis products on a shelf: seed origin, nutrient inputs, transport emissions, and packaging all shape risk and consumer perception. Practical moves that cut risk while lowering footprint include tighter supplier audits, simpler recyclable materials, and on-farm practices that reduce inputs without sacrificing yield, all aligned with demonstrable eco-friendly practices. []

What You’ll Need (Prerequisites & Time Estimate)
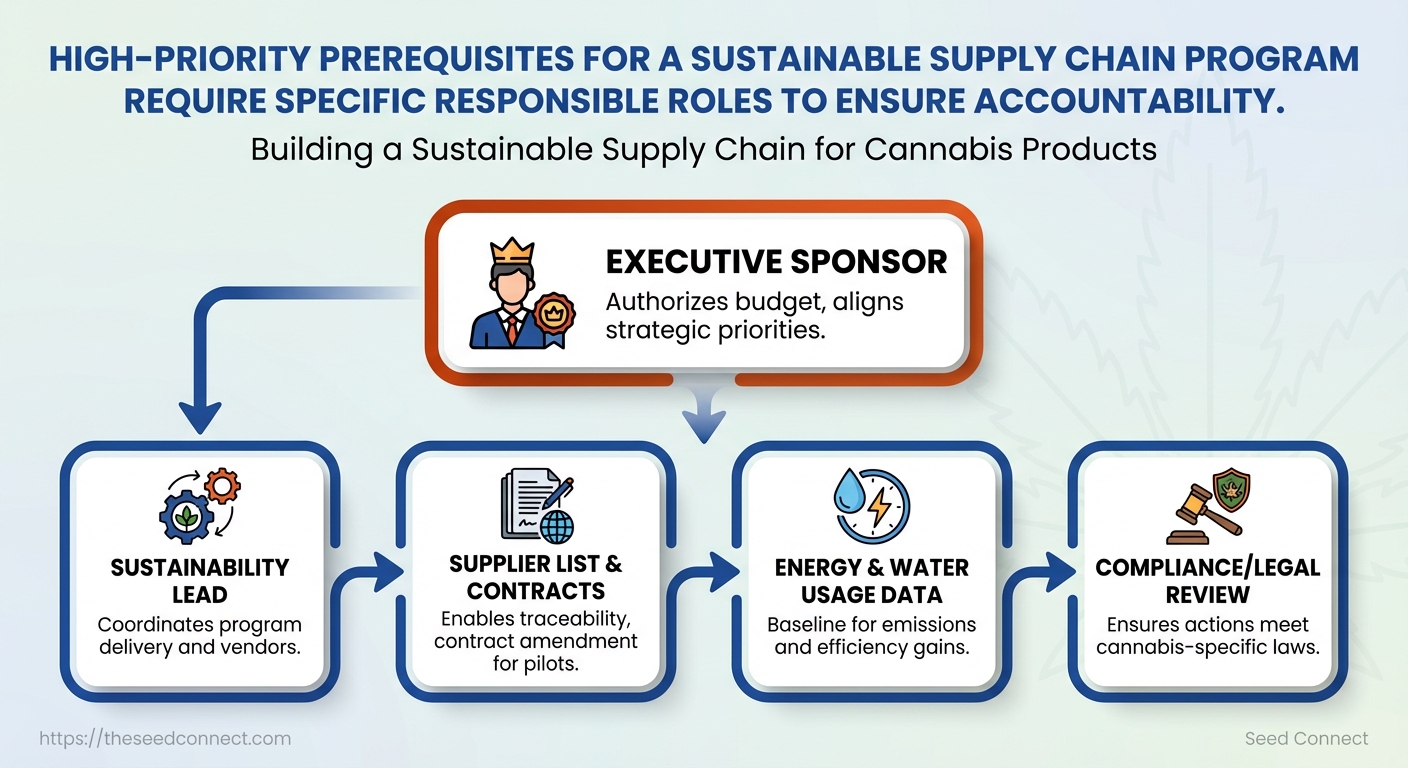
Launching a sustainability program for a cannabis supply chain requires clear ownership, a factual baseline, and realistic timing. Start by securing an executive sponsor and gathering core operational data—supplier contracts, energy and water bills, and compliance history. Legal and compliance checks are non-negotiable given the shifting regulatory landscape. Expect a multi-phase timeline: a focused assessment phase, targeted pilots to validate interventions, and a longer scale phase to embed processes into procurement and operations.
Executive sponsor: Senior leader who approves budget and removes organizational roadblocks.
Sustainability lead: Day-to-day program owner coordinating cross-functional teams.
Supplier list & contracts: Complete vendor roster and contract terms for sourcing and traceability.
Energy & water usage data: Utility bills and meter-level data to quantify baseline consumption.
Compliance/legal review: Jurisdiction-specific cannabis regulations, licensing status, and risk registers.
Stakeholders include procurement, operations, legal/compliance, finance, and external suppliers or growers. Collect baseline metrics before piloting interventions: historical yield and loss rates, greenhouse gas estimates from energy bills, water usage per cultivation cycle, and supplier lead times. These datasets enable measurable pilot design and credible ROI projections.
Typical preparatory tasks: Map stakeholders: Identify internal owners and decision-makers. Gather baseline data: Compile 12–24 months of utility, production, and procurement records. Legal check: Verify licensing boundaries and any reporting obligations. Supplier outreach: Confirm willingness to participate in pilots and share data. * Technical readiness: Ensure monitoring systems (meters, sensors, ERP access) are available.
- Allocate time to internal alignment and data collection: this is often the longest single blocker.
- Run a rapid risk review with legal/compliance to flag impossible actions early.
- Secure supplier commitments and basic monitoring tools before designing pilots.
Map prerequisites to responsible role and urgency to obtain
| Prerequisite | Responsible Role | Why It’s Needed | Priority (High/Med/Low) |
|---|---|---|---|
| Executive sponsor | C-suite (COO/CFO) | Authorizes budget, aligns strategic priorities | High |
| Sustainability lead | Head of Sustainability or Ops Manager | Coordinates program delivery and vendors | High |
| Supplier list & contracts | Procurement Director | Enables traceability, contract amendment for pilots | High |
| Energy & water usage data | Facilities/Operations Manager | Baseline for emissions and efficiency gains | High |
| Compliance/legal review | General Counsel / Compliance Officer | Ensures actions meet cannabis-specific laws | High |
Key insight: Having high-priority owners assigned to each prerequisite reduces delay risk and creates accountability across procurement, operations, and legal teams.
Typical phase durations and key milestones for a sustainability program
| Phase | Duration | Key Activities | Success Milestone |
|---|---|---|---|
| Assessment | 4–12 weeks | Data collection, stakeholder mapping, opportunity scan | Baseline metrics and prioritized roadmap |
| Pilot projects | 3–9 months | Small-scale trials (energy, water, supplier practices) | Demonstrated KPI improvements and ROI signal |
| Scale & integration | 9–24 months | Process redesign, contract updates, technology roll-out | Standardized procedures across sites |
| Continuous improvement | Ongoing | Monitoring, iterative optimizations, training | Sustained performance gains year-over-year |
| Reporting & certification | 3–6 months (concurrent) | Prepare disclosures and pursue certifications | Certification awarded or regulatory reporting met |
Key insight: Timelines expand with organizational complexity and regulatory friction; plan for parallel workstreams to keep momentum.
Difficulty depends on company size, regulatory complexity, and supply chain fragmentation. Larger operators face more coordination overhead; multi-state or international footprints increase legal review time. Dependencies that commonly affect timelines include data availability, supplier cooperation, and permitting windows. Understanding these constraints up front lets teams move faster without sacrificing compliance or measurable impact.
Conduct a Baseline Supply Chain Assessment
Start by mapping what moves through the business today: which suppliers provide which materials, how much volume flows, and how those materials travel from origin to your facility. This baseline is not an academic exercise — it reveals the handful of suppliers and processes that drive most cost, risk, and environmental impact. Collect supplier contact and contract information, quantify material volumes and packaging, and link those flows to energy, water, waste, and emissions data so every interventions targets measurable savings. A reliable baseline uses a mix of direct records (procurement/SAP), supplier questionnaires, and physical utility data mapped to production throughput. That combination lets teams convert bills and invoices into actionable intensity metrics — for example, kWh/kg biomass or L/m2 canopy — and establish a repeatable way to track improvements.
What to collect and why
- Supplier master data: Request full supplier name, contact, and contract IDs to enable follow-up and risk screening.
- Origin details: Capture country, region, and farm/processor to assess transport distance and regulatory risk.
- Transport mode and frequency: Note sea, road, air, multimodal and typical shipment sizes to estimate fuel-related emissions.
- Packaging type: Record material, weight, and reuse/recyclability to target packaging reductions.
- Annual volumes: Use calendar-year totals to prioritize which supplier relationships drive the majority of spend and impact.
Prioritize suppliers by spend and risk: Start with the top 20% by spend or the top 10 by strategic criticality; those will typically represent ~80% of volume and impact.
Step-by-step process
- Pull procurement and ERP exports that include supplier, SKU, annual spend, and quantities.
- Send a concise supplier questionnaire requesting origin, packaging specs, transport mode, and any environmental data.
- Aggregate utility bills and map them to production volumes for the same period.
- Convert aggregated data into intensity metrics using
kWh/kg,m3/kg, andkgCO2e/kgwhere possible. - Prioritize remediation opportunities by combining spend, volume, and intensity into a simple rank.
Tools and outputs
- Supplier data template: Use the table below to capture the minimum fields needed for supplier conversations.
- Performance dashboard: Track
energy intensity,water intensity, andwaste per unitmonthly to spot trends. - Checklist: Ensure contracts include data-sharing clauses for future audits.
Provide a sample supplier data collection template
| Supplier Name | Location (origin) | Product/Material | Annual Volume | Transport Mode | Packaging Type |
|---|---|---|---|---|---|
| Supplier A | Humboldt County, CA, USA | Organic potting soil | 120,000 kg | Truck (FCL) | 25 kg woven polypropylene bags |
| Supplier B | British Columbia, Canada | Nutrient solution concentrate | 48,000 L | Road & Short-sea | 20 L HDPE jugs |
| Supplier C | Jalisco, Mexico | Humidity control beads | 5,400 kg | Air + Truck | 1 kg sealed foil pouches |
| Supplier D | Oregon, USA | Grow lights (bulbs) | 3,000 units | Truck (LTL) | Cardboard + plastic wrap |
| Supplier E | Netherlands | CO2 cylinders | 2,000 cylinders | Sea + Truck | Steel cylinder, reusable |
Key insight: Capturing origin, transport mode, volumes, and packaging enables rapid emissions and waste estimates and highlights which suppliers to engage first for sustainability improvements.
Common emissions estimation methods and their accuracy/resource needs
| Method | Accuracy | Required Data | Suitable For |
|---|---|---|---|
| Direct measurement (metering) | High | Monthly kWh/m3 meter reads, fuel logs |
Facilities with on-site meters and regular utility data |
| Activity-based estimates | Medium-high | Process activity (hours, machine use), equipment specs | Production lines with known operational profiles |
| Spend-based estimates | Low | Procurement spend by category, sector emission factors | Early-stage assessments or when no activity data exists |
| Supplier-provided data | Variable | Supplier utility/production records, emissions reports | When suppliers report verified data or have measurement systems |
| Third-party calculators | Medium | Basic activity inputs, distance, transport mode | Quick estimates and scenario modeling |
Key insight: Metering delivers the most reliable intensity metrics; spend-based methods are a pragmatic fallback but carry greater uncertainty.
Understanding these foundations lets teams move from guesses to measurable interventions and ensures early decisions produce verifiable improvements. When applied consistently, this approach reduces uncertainty and speeds up higher-impact sustainability projects.
Set Clear Sustainability Goals and KPIs
Start with specific, measurable targets that link to business outcomes rather than vague aspirations. Use the SMART framework to convert high-level ambitions into operational goals, then define a handful of priority KPIs that track progress in units your teams already measure (energy, water, packaging weight, supplier audits, transport emissions). Clear KPIs make trade-offs visible and speed decision-making across finance, operations, and compliance.
SMART Goals and Priority KPIs
SMART Goal: Reduce facility energy intensity by 20% within 24 months.
Priority KPI: Energy intensity = total site energy (kWh) ÷ finished product mass (kg).
How to calculate and report each KPI Energy intensity: Sum metered kWh across electricity and fuel for the reporting period, divide by kilograms of produced product; report monthly and rolling 12-month trend. Water intensity: Total process water (L) ÷ product mass (kg); report per build and normalized for seasonal irrigation differences. % sustainable packaging: Weight of recycled or reusable packaging (kg) ÷ total packaging weight (kg) × 100; track by SKU. Supplier sustainability compliance rate: Number of suppliers meeting checklist criteria ÷ total suppliers × 100; update after each audit cycle. * Transport emissions (CO2e/unit): Sum transport fuel CO2e for inbound/outbound logistics ÷ units shipped; use standard emission factors.
Prioritizing Goals and Gaining Stakeholder Buy-in
- Assess impact, feasibility, and cost for each potential goal.
- Score goals on a simple 1–5 scale for impact (carbon/water reduction), feasibility (current tech/process fit), and cost (CAPEX/OPEX).
- Rank by composite score and select the top 3 to pilot.
Prepare a one-page business case for each prioritized goal that includes: Problem statement: current KPI baseline and pain points. Proposed action: what will change and who owns it. Expected benefits: quantified energy/water/cost reductions. Estimated cost and timeline: CAPEX/OPEX and milestones. * Risk and mitigation: operational impacts and fallback plans.
Tailor messaging to stakeholders: Finance: emphasize ROI, payback period, and impact on operating margin. Operations: focus on implementation steps, resource needs, and downtime risk. * Compliance: highlight regulatory alignment, audit evidence, and reporting cadence.
Practical example: a one-page case to replace HID lights with LED should include measured baseline energy intensity (e.g., 120 kWh/kg), projected energy intensity (e.g., 96 kWh/kg), simple payback (months), and operational impacts (no production downtime).
Example goals with KPIs, baseline, target, and timeline
| Goal | KPI | Baseline | Target (timebound) |
|---|---|---|---|
| Reduce energy use | Energy intensity (kWh/kg) | 120 kWh/kg | 96 kWh/kg (20% reduction, 24 months) |
| Reduce water use | Water intensity (L/kg) | 50 L/kg | 35 L/kg (30% reduction, 18 months) |
| Increase recycled packaging | % sustainable packaging | 10% | 50% (18 months) |
| Supplier sustainability compliance | Supplier compliance rate (%) | 60% | 95% (24 months) |
| Reduce transport emissions | CO2e per unit (g/unit) | 200 g/unit | 140 g/unit (30% reduction, 36 months) |
Key insight: The table links concrete baselines to achievable, timebound targets so teams can prioritize investments. Using unit-based KPIs (per kg or per unit) normalizes production variability and creates an apples-to-apples view for finance, operations, and procurement.
Understanding how to translate ambition into SMART goals and a short list of measurable KPIs keeps execution pragmatic and traceable. When those targets are framed in financial and operational terms, stakeholders move from permission-givers to active participants. This is how sustainability becomes a decision-making lens rather than a side project.
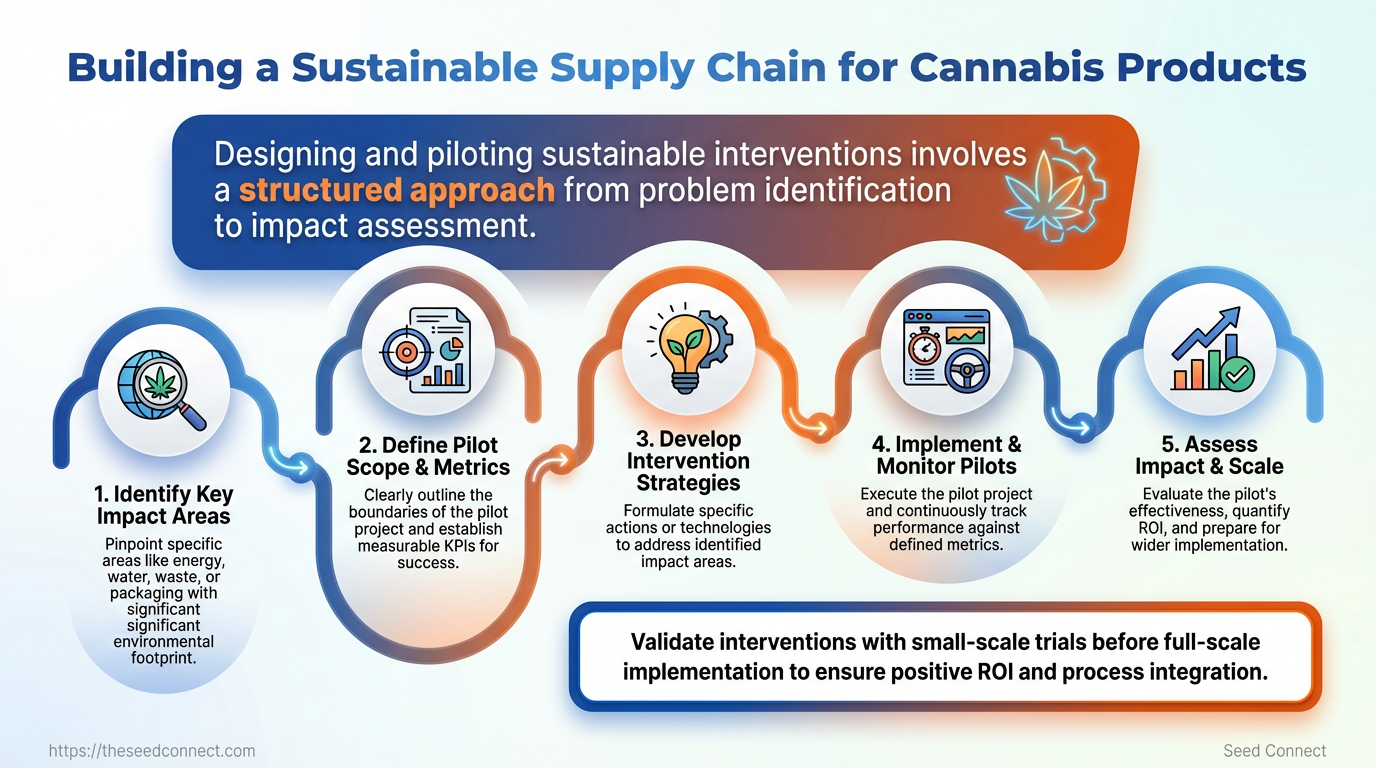
Design and Pilot Sustainable Interventions
Start by choosing interventions that deliver measurable environmental benefit and quick financial payback. Prioritize projects that reduce energy and water use, cut packaging waste, or lower transport emissions—these tend to show the clearest KPIs and fastest returns. The design phase should create a tight feedback loop: define baseline metrics, set a clear success threshold, and plan a time-limited pilot with a control group where feasible.
Select High-Impact Interventions (how to prioritize)
- Energy-efficient lighting & HVAC: Replace legacy HID or inefficient HVAC with LEDs and modern controls; focus on
kWhsavings and load shifting. - Water recapture and reuse: Capture runoff and condensate for reuse in irrigation to reduce municipal water demand.
- Sustainable packaging switch: Move to compostable or recycled materials and right-size packaging to reduce waste and materials cost.
- Supplier sourcing policy: Replace high-emission suppliers with lower-impact alternatives and require environmental data from vendors.
- Freight consolidation & mode shift: Consolidate shipments, favor rail/intermodal over short-haul trucking where practical.
Interventions by impact, cost range, typical payback, and implementation complexity
| Intervention | Environmental Impact | Estimated Cost Range | Typical Payback | Complexity |
|---|---|---|---|---|
| LED & HVAC upgrades | Large energy and emissions reduction | $20,000–$200,000+ | 1–4 years | Medium–High |
| Water recapture/reuse | Significant potable water reduction | $5,000–$100,000 | 1–3 years | Medium |
| Sustainable packaging switch | Reduced plastic waste, lower disposal cost | $2,000–$50,000 | 6–18 months | Low–Medium |
| Supplier sourcing policy | Scope 3 emissions reduction potential | Minimal admin cost to implement | 6–24 months (procurement cycles) | Low |
| Freight consolidation & mode shift | Lower transport emissions, cost savings | $1,000–$50,000 (systems/process) | 6–18 months | Medium |
Key insight: Interventions like LED/HVAC and water recapture command higher upfront costs but deliver predictable energy and water savings; packaging swaps and supplier policy changes are low-cost, fast-payback levers that compound when combined.
Run a Pilot: Step-by-Step
- Define objectives and success criteria (baseline reduction targets, payback threshold, measurement methods).
- Identify pilot site(s) and, if possible, a control group that remains on the existing system.
- Establish baseline measurements for energy (
kWh), water (gallons), waste (kg), and cost for at least 30–90 days. - Implement the intervention at the pilot site using a scoped schedule and vendor agreements.
- Monitor performance in real time where possible; collect weekly operational notes and monthly metered data.
- Compare pilot vs. control and against baseline; calculate simple payback, ROI, and environmental metrics (e.g., CO2e avoided).
- Document lessons learned, failure modes, and recommended scale-up steps with a phased roll-out plan.
Practical examples include swapping a single cultivation room to LED and tracking kWh and yield continuity, or trialing compostable packaging on one SKU to capture customer feedback and cost delta. Understanding these principles helps teams move faster without sacrificing quality. When implemented correctly, pilots create the evidence base needed to scale high-impact sustainability changes.
Engage and Certify Suppliers
Begin engagement with the suppliers that carry the most financial or regulatory risk and move outward. Start by sending a concise questionnaire, score responses to triage candidates for on-site or remote audits, and then lock requirements into contracts that include certification and corrective-action paths. This keeps due diligence proportional, repeatable, and defensible.
Supplier Engagement and Questionnaire
Start with a targeted outreach to suppliers that represent the top 80% of spend or those supplying regulated inputs (propagules, nutrients, packaging). Use a short, scored questionnaire to identify red flags and opportunities.
- Prepare and send the questionnaire.
- Score answers (0–3 scale) and assign audit priority.
- Offer alternative compliance paths for small suppliers (e.g., third-party attestations, shorter audits).
Scoring system example: 0 = no evidence, 1 = partial, 2 = documented, 3 = certified. Audits required for suppliers scoring ≤1 or with regulatory exposure.
Certification, Audits, and Contracts
Certifications relevant to cannabis supply commonly include GMP (Good Manufacturing Practice), ISO 14001 (environmental management), and third-party workplace safety audits. For seed and plant material, phytosanitary certificates and traceability records are essential.
Audit cadence recommendations: High priority: annual on-site audits. Medium priority: biennial remote audits + documentation review. * Low priority: documentation review every 12–24 months.
Sample contractual sustainability clauses: Traceability clause: Supplier must provide batch-level traceability data for each shipment within 48 hours. Compliance clause: Supplier warrants all products comply with applicable cannabis regulations and holds necessary permits. Corrective action clause: Supplier agrees to a 30-day corrective-action plan for non-conformances identified during audits. Germination guarantee addendum: For seed suppliers, maintain a minimum germination rate and remediate failed lots.
Practical examples and risk paths
- Small nursery: Accept a signed attestation plus photos of growing environment and a third-party lab test instead of an on-site audit.
- Packaging vendor: Require material safety data sheets, recycled content certificates, and an environmental policy—audit only if claims are unverifiable.
- High-volume seed supplier: Mandate third-party germination tests and annual on-site inspection.
Provide a supplier questionnaire template with sections and sample questions
| Section | Sample Questions | Expected Evidence | Priority |
|---|---|---|---|
| Environmental management | Do you have an environmental management system? Describe it. | EMS description, ISO 14001 certificate if available | High |
| Water & energy use | How do you monitor water and energy per unit produced? | Meter logs, usage reports, reduction targets | Medium |
| Packaging practices | What % of packaging is recyclable or compostable? | Supplier spec sheets, certificates of recycled content | Medium |
| Labor & safety | Do you perform worker safety training and audits? | Safety policy, training records, incident logs | High |
| Traceability | Can you provide lot-level traceability from seed to shipment? | Traceability logs, batch IDs, COAs | High |
Key insight: The table prioritizes evidence-based questions that distinguish suppliers ready for minimal oversight from those requiring audits, enabling resource-focused supplier management.
Understanding these engagement steps reduces time spent chasing documentation and makes certification outcomes predictable, freeing teams to focus on supplier development rather than fire-fighting.
Implement Operational Changes and Scale
Start by sequencing changes so teams deliver value fast while minimizing disruption. Prioritize high-impact, low-friction pilots, embed new procurement and sustainability criteria into workflows, and deploy tracking systems that feed existing ERPs and reporting. Training, clear ownership, and measured automation are the levers that convert policy into repeatable operational practice.
Rollout Plan and Operations Integration
- Conduct a readiness assessment with cross-functional owners.
- Run focused pilots in one facility or product line to validate processes and tools.
- Update procurement rules and supplier contracts to include sustainability criteria and germination-quality clauses where relevant.
- Train operations and procurement teams on new requirements, KPIs, and exception handling.
- Expand rollouts iteratively, using data from pilots to refine SOPs and SLAs.
- Owner alignment: Assign single-point owners for procurement, operations, IT, and supplier management.
- Procurement integration: Embed sustainability checklists into purchase orders and
vendor onboardingforms. - Training cadence: Combine a one-day workshop with on-the-job coaching and a quarterly refresher.
Technology and Data Systems
Select tools that record, analyze, and report sustainability metrics alongside operational KPIs.
- Must-have features: Real-time metric capture, configurable dashboards, supplier scorecards, and API-based ERP integration.
- Vendor selection checklist: Evaluate data model compatibility, API availability, user roles/permissions, deployment timeline, and total cost of ownership.
- Integration priorities: Start with data flows into the ERP for cost and inventory reconciliation, then sync to POS for product-level sustainability labels.
When evaluating vendors, prioritize those that support CSV/JSON exports, have modular pricing, and offer professional services for initial mapping.
Practical example
A pilot program replaced paper-based supplier vetting with a digital scorecard integrated into the procurement module of the ERP, cutting vendor qualification time from weeks to days and surfacing low-performing suppliers for consolidation.
Implementation tips
- Measure early: Capture baseline energy, waste, and supplier scores before changes.
- Automate reporting: Use scheduled exports to populate compliance dashboards.
- Govern changes: Hold monthly steering reviews for the first 6 months.
A sample 12-month rollout schedule with milestones and owners
| Month | Activity | Owner | Success Indicator |
|---|---|---|---|
| Month 1-2 Assessment follow-up | Complete baseline metrics & stakeholder interviews | Program Manager | Baseline dashboard live |
| Month 3-4 Pilot wrap & evaluation | Pilot new procurement rules & tech in one facility | Operations Lead | Pilot meets KPIs (≥80% compliance) |
| Month 5-7 Policy updates & procurement integration | Update contracts, SOPs, PO templates | Procurement Director | Updated templates in ERP |
| Month 8-10 Supplier onboarding & tech deployment | Onboard suppliers; deploy vendor portal & dashboards | Supplier Manager / IT Lead | 75% suppliers onboarded |
| Month 11-12 Review & scale adjustments | Evaluate outcomes; plan roll-forward to other sites | Program Sponsor | Decision to scale + ROI report |
Key insight: The timeline sequences assessment → pilot → policy → supplier & tech → review, concentrating early learning in a contained pilot to reduce risk and accelerate measurable adoption.
Understanding these principles helps teams move faster without sacrificing quality. When implemented deliberately, changes become self-sustaining and free operational teams to focus on consistent product quality and growth.
Troubleshooting Common Issues
When supplier cooperation is weak and measurement data are incomplete, practical flexibility plus a clear escalation pathway keeps projects moving. Start by accepting reasonable data proxies and offering phased compliance that reduces supplier risk; pair that with low-cost pilots and sensitivity testing so budget uncertainty doesn’t stall decisions. These combined tactics preserve momentum while you close gaps in rigor and funding.
Addressing Supplier Resistance and Data Gaps
- Offer phased compliance.
- Start with a one-quarter pilot asking for high-level metrics only.
- Scale reporting requirements after the pilot demonstrates value.
- Use incentives to reduce resistance.
- Financial incentive: small up-front payments or faster payment terms for compliant suppliers.
- Operational incentive: technical support, consolidated logistics, or bundled purchasing benefits.
- Accept reasonable proxies while requesting improvements.
- Proxy example: use energy bills and production hours as a proxy for per-unit energy use when submetering is absent.
- Improvement cadence: request progress milestones (3–6 months) toward direct measurement.
- Escalation and contingency plans.
- Soft escalation: involve category managers to negotiate reporting concessions.
- Hard escalation: substitute non-compliant suppliers on a defined timeline or hold a portion of payment in escrow tied to data delivery.
Budget Limits and Measurement Uncertainty
Pilot-first budgeting reduces upfront spend. Run micro-pilots that test the intervention at 5–10% scale and evaluate with sensitivity analysis to understand how uncertain inputs affect outcomes.
Funding options to stretch limited budgets:
- Local rebates: utility rebate programs for LED retrofits and energy audits.
- Vendor financing: deferred payment plans from equipment vendors.
- Grants: state-level sustainability or agricultural grants for cannabis products operations.
Low-cost interventions and funding sources
| Intervention | Approx. Cost | Funding Options | Expected Impact |
|---|---|---|---|
| LED lighting retrofit | $40–$120 per fixture | Utility rebates, vendor financing | 20–50% energy savings over HPS |
| Packaging material change | $0.02–$0.15 per unit | Supplier co-funding, bulk discounts | Reduced waste + brand value lift |
| Freight consolidation | $500–$2,000 setup | Internal cost savings, 3PL incentives | 10–25% shipping cost reduction |
| Basic energy audits | $500–$3,000 | Utility programs, vendor promos | Identifies 5–15% savings opportunities |
| Supplier training | $1,000–$5,000 | Co-funded with suppliers | Better compliance; faster data flows |
Key insight: Low-cost pilots and targeted funding sources typically deliver the fastest ROI while reducing financial risk. Combining vendor incentives with utility rebates often closes the budget gap for capital items like lighting, and audits reveal low-effort changes that improve measurement fidelity.
Understanding these practical options and escalation paths prevents stalled projects and keeps teams focused on measurable improvements without overcommitting resources. When implemented with discipline, this approach reduces risk while building supplier capacity and data confidence.
📥 Download: Sustainable Supply Chain Checklist for Cannabis Products (PDF)
Tips for Success and Pro Tips
Start by assigning clear ownership for each part of the grow and supply process; without accountable owners, even the best plans stall. Operational discipline — documented responsibilities, measurable KPIs, and routine review cadences — turns ad hoc success into repeatable outcomes. Embed sustainability and quality requirements into procurement, measure them, and report progress publicly so adjustments happen fast and credibly.
Operational tips to stabilize production
- Clear owners: Assign a single owner for propagation, one for nutrient strategy, and one for post-harvest quality.
- Standard operating procedures: Convert tacit knowledge into SOPs with photos,
PPM/ECtargets, andpHbands for each growth stage. - Daily short-cycle feedback: Use quick morning huddles or a shared log to flag environmental drift or pest issues immediately.
- Seed-to-shelf traceability: Capture batch IDs from seed lot through drying to final product to isolate failures quickly.
- Use proven genetics: Choosing seeds with a germination guarantee reduces variability and downstream rework.
Long-term strategies for resilience and sustainability
- Establish governance with a steering committee that meets monthly.
- Define measurable sustainability objectives (energy per kg, water per kg, waste diversion) and include them in vendor scorecards.
- Write supplier contracts that require environmental disclosure and allow audits or corrective action plans.
- Publish concise quarterly sustainability and quality reports for internal stakeholders and retail partners.
- Iterate on supplier performance using a simple RAG (red/amber/green) system tied to contract renewal decisions.
Practical examples and metrics
- Example — Governance: A mid-size operator reduced batch failures 30% year-over-year by creating an Ops Lead role accountable for batch sign-off.
- Example — Procurement scorecard: Typical scorecards weigh germination rate, lead time, carbon intensity, and cost — each scored out of 10.
- Example — Reporting cadence: Weekly operational dashboards and quarterly public reports create pressure to improve measurable metrics.
Sustainability in contracts: Require baseline energy and water use disclosure, with annual improvement targets.
Procurement scorecard: Include sections for compliance, germination performance, delivery reliability, and environmental metrics.
Understanding these principles helps teams move faster without sacrificing quality. When sustainability and ownership are baked into contracts and scorecards, continuous improvement becomes part of routine operations rather than an afterthought.
Case Study Examples and Benchmarks
An energy retrofit at a cultivation facility and a sustainable packaging rollout are two practical initiatives that deliver measurable ROI while improving environmental performance. The retrofit reduces utility costs and often pays back within a 2–4 year window depending on scale and incentives; the packaging swap reduces waste, strengthens brand perception, and can generate a marketing uplift that offsets higher unit costs. Below are concrete steps, metrics, and comparative data to guide pilots and scale decisions.
Energy Retrofit at a Cultivation Facility
Begin with a pilot that isolates one grow room or one veg/flower zone so changes and results are attributable.
- Conduct a baseline audit of energy use, lighting schedules, HVAC run-hours, and defrost/heat cycles.
- Implement pilot measures (one change at a time) such as
LED retrofit,VFDs on fans, orsmart thermostats. - Monitor for 90–180 days to capture seasonal variation, then compare to baseline.
- Scale measures that meet payback and performance targets.
- Typical savings: 20–50% on lighting and 10–25% on HVAC energy depending on existing equipment.
- Typical payback timeline: 2–4 years for LED + controls at commercial electricity rates.
- Key metrics to collect:
- kWh per square foot: daily and monthly
- Peak demand (kW): to quantify demand charge impact
- Yield per cycle: to ensure no negative crop impact
- Temperature and RH stability: setpoint deviation minutes per day
- Maintenance hours and consumables cost
Practical tips: run one variable at a time, tag sensors and meters to avoid data confusion, and include a small reserve budget for unforeseen integration costs.
Sustainable Packaging Rollout
Start with a pilot SKU cluster to test supply chain, shelf-life, and customer reaction.
- Coordination needs: supplier lead times, regulatory labeling requirements, and compatibility with sealing/machinery.
- Testing focus: seal integrity, odour barrier performance, and child-resistant mechanism function.
- Cost vs benefit considerations: packaging swaps often increase per-unit cost 5–30%, while improving brand perception and reducing landfill contribution.
Packaging materials by compostability, cost impact, and regulatory considerations
| Material | Compostable? | Cost Impact | Regulatory Notes |
|---|---|---|---|
| Recycled paperboard | ✗ | Low–Moderate ($0.01–$0.05/unit) | Must meet moisture/ODR requirements for cannabis labeling |
| Compostable bioplastic | ✓ | Moderate–High ($0.03–$0.12/unit) | Verify industrial vs home compostability claims for compliance |
| Glass | ✗ | High ($0.10–$0.50/unit) | Strong inertness; heavier shipping costs and child-resistant closures needed |
| Lightweight PET | ✗ | Low ($0.005–$0.03/unit) | Widely accepted; recyclable but landfill leakage is a concern |
| Hemp-based packaging | ✓ | Moderate ($0.04–$0.15/unit) | Emerging option; verify material certification and barrier properties |
Key insight: Compostable options improve sustainability messaging but often raise costs and sometimes require industrial compost infrastructure; recycled and lightweight PET give cost advantages but need end-of-life strategy.
Understanding these principles helps teams move faster without sacrificing quality. When pilots are structured to collect consistent operational and market metrics, decisions scale with confidence and minimal disruption.
Conclusion
After running a baseline assessment, setting measurable goals, piloting targeted interventions, and bringing suppliers into the fold, a resilient, low-risk sustainable supply chain for cannabis products is within reach. Evidence from the case studies earlier — a cultivator who cut transport emissions 30% by consolidating regional suppliers, and a processor that reduced packaging waste through a pilot swap — shows that small pilots lead to scalable wins. Expect hiccups around supplier buy-in and record-keeping; address those by making supplier certification and transparent metrics mandatory and by automating traceability where possible. For growers wondering whether to start with packaging or logistics, begin where the biggest leakage is: inventory loss, failed germination, or last-mile delays. For manufacturers asking how to show progress, prioritize KPIs that buyers and regulators care about.
Next steps: review your baseline findings, run a 60–90 day pilot focused on one upstream and one downstream intervention, and lock in supplier agreements that include clear eco-targets. Document results, iterate, and scale successful pilots across operations. For access to reliable genetics, germination support, and supplier continuity solutions, consult the Seed Connect catalog (Seed Connect catalog) as one practical resource to avoid seed-related surprises while advancing eco-friendly practices.